Two analysts can arrive at the same revenue forecast by taking opposite routes. One expects a company to sell more at yesterday’s prices. The other expects fewer sales at higher prices. Average their answers and the disagreement disappears. Yet the disagreement may be the most useful thing an investor could know.
Visible Alpha built a business around that missing conversation. It takes the working spreadsheets of sell-side analysts, extracts their forecasts and assumptions, and makes the numbers comparable. The customer gets to ask a better question: what, precisely, does Wall Street believe has to happen?
- The raw material: analysts’ working models, with operating assumptions beneath the earnings estimate.
- The buyers: professional investors, investment banks and corporate teams.
- The bet: comparable details make research more useful than another headline number.
Five banks, one translation problem
The origin contains a pleasing complication. In May 2015, five banks announced Visible Alpha: BofA Merrill Lynch, Citi, Jefferies, Morgan Stanley and UBS. These were competitors whose analysts produced the very models the new company needed. They were helping build a shared way to inspect their own work.
Scott Rosen, the founding chief executive, described the intended reach plainly: This will be a conduit for trusted research providers, beyond just the largest global firms.
The ambition was a common language. A model could contain product pricing, segment forecasts and industry-specific operating assumptions, but its usefulness shrank when someone had to translate every row before comparing it with another bank’s version.
At the announcement, the service was in limited beta. Commercial availability followed in February 2017, with more than twenty research contributors and consensus models for over 1,500 companies. The interval matters. The initial obstacle was already there in the product brief: extracting numbers was only part of the job. Making them comparable was the business.
In January 2018, Visible Alpha announced $38 million in additional equity financing, led by Goldman Sachs. All existing investors participated alongside six new strategic investors. The stated uses included growth and tools for research valuation and budgeting. This was infrastructure financed partly by the institutions supplying its raw material.
Agreement has moving parts
Consider a practical example from S&P Global’s September 2026 consumer-products research. Its Visible Alpha analysis separated revenue expectations into volume, pricing and other contributions. That distinction changes the conversation. Growth sustained by customers buying more raises different questions from growth sustained by charging them more. The headline percentage alone cannot settle them.
For a portfolio manager, that means locating the assumption their own thesis challenges. For an investment banker, it means assembling comparable expectations without repeatedly copying numbers from reports. In a published customer video, Jefferies investment-banking analyst David Fink describes the difficulty of accessing research and consensus data through manual processes, and the time recovered with Visible Alpha.
and assumptions
and compare
Who disagrees?
The main product, Insights, provides consensus and broker estimates with comparison, revision and earnings-surprise tools. An Excel Add-In brings the data into the spreadsheet where much of this work already happens. APIs, feeds and Snowflake delivery serve teams that want to query datasets or build the information into their own systems.
That puts Visible Alpha in the institutional estimates market alongside alternatives such as Bloomberg, FactSet and LSEG. Its chosen emphasis is the detail inside working models. A buyer should test the specific companies and metrics they need, rather than treating every consensus dataset as interchangeable. The value is in the relevant rows.
Two matching totals can hide two very different ideas about the future.
A drug is a small economy
BioPharma, launched in February 2024, makes the argument especially concrete. A medicine’s revenue forecast can depend on which diseases it treats, where it sells, when it launches and how analysts account for development risk. A company-wide sales number bundles all those questions into a single answer.
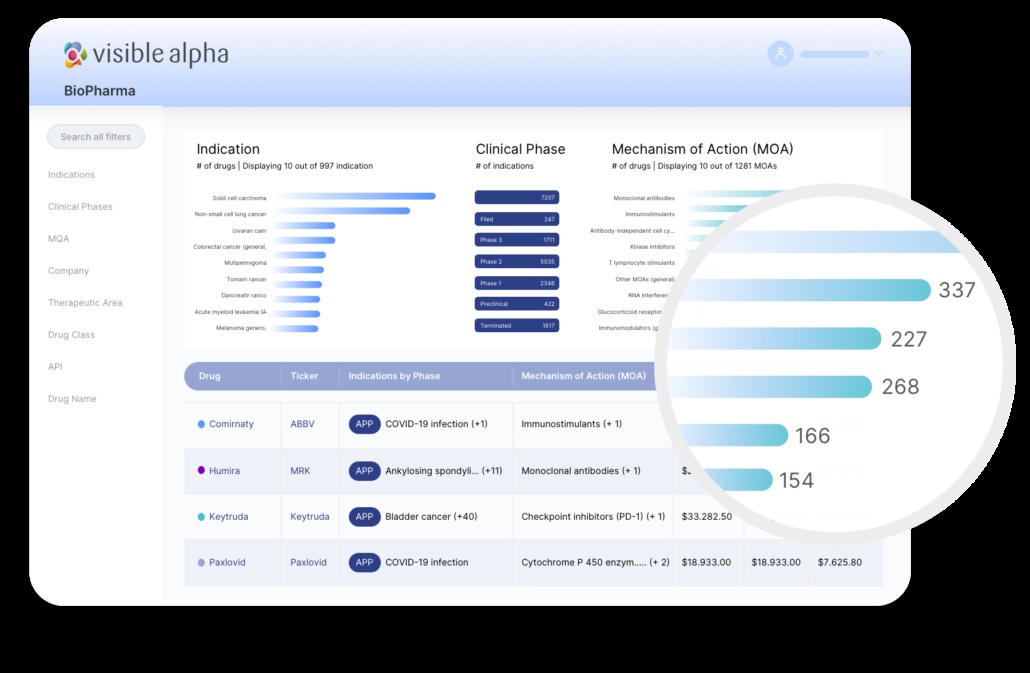
The platform lets users inspect drug-level forecasts by indication and geography, compare broker estimates and view gross and risk-adjusted revenue projections separately. Its public product page describes a universe of more than 6,300 marketed and pipeline drugs. For investors and drug developers, the appeal is a commercial map assembled from underlying models.
There is a condition attached to all this precision: the model still contains someone’s judgment. A neatly standardized estimate can be wrong. Analysts can share an optimistic assumption, and coverage can be thin where a user most needs detail. Seeing the inputs makes that risk easier to examine; it does not remove it.
The company’s AI Monitor offers another revealing example. It groups selected technology businesses using revenue lines exposed to AI, then follows their expectations and performance. The methodology explicitly treats those lines as approximations, because AI activity is intertwined with conventional technology revenue. Even a detailed dataset needs a careful definition of what it measures.
That is a useful discipline for the buyer, too. Before building a comparison, decide what belongs in the group, what each metric means and which assumptions deserve scrutiny. More rows help when they answer the question you actually have.
The spreadsheet gets a bigger address
S&P Global completed its acquisition of Visible Alpha on May 1, 2024, placing it within Market Intelligence. In March 2025, the data became an add-on offering inside Capital IQ Pro. The business sells professional access to research data and tools; an existing platform subscription does not automatically mean every additional dataset is included.
The next distribution step arrived on October 15, 2026. S&P Global made Visible Alpha data available through its AI Data Portal, reporting coverage of more than 8,000 companies and over 250 contributing brokers. Structured retrieval was available immediately; support for more open-ended Adaptive Retrieval was expected later that year.
The interface keeps changing, from web screens to Excel to AI applications. The useful habit remains wonderfully ordinary: inspect the assumption before trusting the total. Anyone comparing forecasts can copy it. First align the definitions. Then separate the drivers. Finally, ask where your own view differs. Visible Alpha sells a way to make that work faster.