data-visualization
(66)
The Hundred No’s That Built a Presentation Factory
Rick Enrico’s software pitch collected roughly 100 rejections. The compliment hidden inside those no’s became SlideGenius - a global agency built for the moment when the meeting matters more than the slides suggest.
The Firm Built on the Idea Everyone Else Called a Fantasy
Two firms said an education-only communications practice would never work. Twenty-five years, 500-plus convenings, and work in every state later, Collaborative has made specialization look less like a constraint than a cheat code.

The $100 Ad That Became a Content System
Column Five started with failed apparel businesses, a roughly $100 banner ad, and infographics that sent millions of visits to Mint. Sixteen years later, it sells something harder to draw: a repeatable way for complicated B2B companies to sound like themselves everywhere.

The Campaign Around the Campaign: How Unearth Makes Influence Feel Personal
Most political advertising buys an audience. Unearth maps the people around the person who matters - then supplies the data, messages and timing to make an issue difficult to ignore.

Message Lab asks: did anybody actually read it?
A client had 82,000 pageviews and a five-second problem. Message Lab at Orchestra builds editorial programs around the difference between attracting a click and earning someone’s attention.

Wondershare Edraw sells a head start on the blank page
A floor plan, a hiring process, a factory bottleneck: Edraw puts them in the same drawing toolbox. Its bet is that the hardest part of explaining an idea is getting the first useful version onto the page.

M’idea Hub and the expensive life of a confusing slide
A presentation can look finished and still leave everyone doing extra work. M’idea Hub builds decks and reusable slide systems for the founders, investors, and teams caught in that gap.

Macrobond wants your next chart to be your last rebuild
The financial research company made a business out of keeping data, analysis and charts connected. Now it is taking that same idea into interactive publishing and AI.
Orgvue lets you rehearse the reorganization
Before a company moves people, it needs to understand the work. Orgvue turns workforce data into costed scenarios - and gives HR and finance a common picture to argue over.
The Software That Taught Investigators to See the Hidden Network
Before knowledge graphs became a boardroom phrase, i2 was helping detectives turn phone logs and witness statements into maps of who knew whom. Thirty-six years later, its most important feature is still the one no model can automate away: showing the analyst their work.
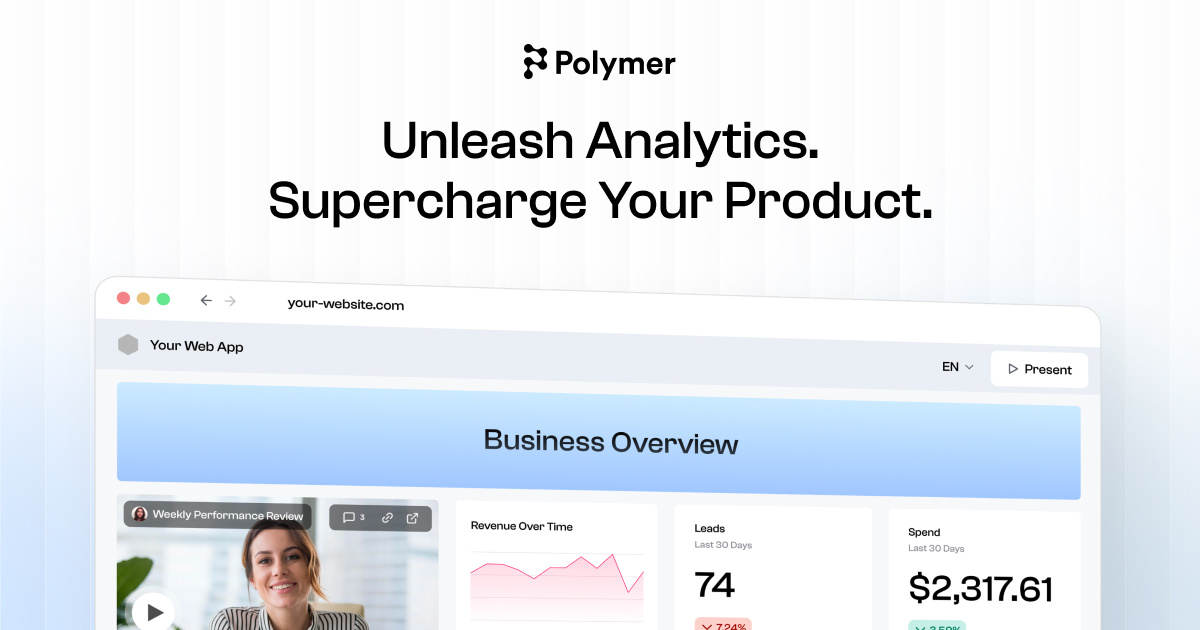
Polymer Makes the Dashboard Part of the Product
Polymer began by making spreadsheets searchable. Its sharper pitch now is to put polished, self-serve analytics inside the software your customers already use - without building a BI team first.
Julius AI Wants Your Spreadsheet’s Messy Job
Give Julius a workbook and a decent question, and it will do the coding, draw the chart, and draft the deck. The bargain is speed in exchange for one non-negotiable chore: check the numbers.
Quadratic Is the Spreadsheet That Shows Its Work
AI can fill a spreadsheet with answers. Quadratic’s better trick is leaving the formulas, code and charts where humans can inspect them, change them and run them again.

Andy Bergmann Has Spent a Career Making Complicated Things Feel Obvious
Before he marketed software that untangles prior authorization, Andy Bergmann made charts behave like stories, turned 37 years of waves into a game, invented a four-ended measuring spoon, and gave a giraffe an orchard. The medium keeps changing. The instinct does not.

Causal Took the Spreadsheet Apart and Kept the Good Bits
Most finance software asks you to love the spreadsheet or leave it. Causal chose the more interesting option: keep the grid, retire the cell-address archaeology, and let the whole company touch the forecast without breaking it.

Domo Built the Business Dashboard. Now Its $400 Million Exit Is the Real Data Point
Domo spent 16 years turning scattered corporate data into dashboards, apps, workflows, and AI agents. Its next chapter is a $400 million sale to Progress - a useful lesson in both the power and the economics of becoming a company’s data operating layer.

InetSoft Spent 29 Years Making Business Intelligence Less of an IT Project
The New Jersey software company started with a Java reporting engine and survived every new era of analytics. Its current bet is that the next BI winner will be smaller, embeddable and open enough to run wherever the data already lives.

Qlik’s 33-Year Bet: The Dashboard Was Only Half the Job
Qlik built its name by letting people wander through data instead of following a prewritten query. Then it bought the pipes beneath the charts - and turned a clever analytics engine into a much larger bet on enterprise AI.

Ellen Hui Put the Backend Engineer in the Boardroom
After petabyte queries, self-driving reliability, and real-time video, Ellen Hui tried to repair the place where company data so often goes to lose its freshness: the slide deck.

Connor Jones Is Building a Place Where AI Work Can Stick Around
After years inside finance and operations, the BitBoard co-founder is giving AI analysis a memory - with dashboards, traceable logic and a stubborn respect for work that can be checked.

Andriy Mulyar Is Teaching AI to Read the Blueprints
The Nomic founder went from clinical language models to open-source AI on a laptop. Now he is narrowing the map, building agents that can navigate the drawings, specifications and institutional memory behind the physical world.
Rollstack Found a $13 Million Business Hiding Between the Dashboard and the Boardroom
Companies spent billions modernizing their data stacks, then left analysts copying charts into slides every Friday. Rollstack turned that absurd little gap into an enterprise software company - and its customers say the hours come back fast.

Toucan Bootstrapped to $5 Million ARR - Then Bet the Company on Analytics You Can Talk To
The French founders let customers fund the product before investors got a look. A decade later, Toucan is making a sharper wager: the winning dashboard may be the one users never have to learn.

Alex Bilmes Keeps Building the Missing Context
From Cloudability dashboards to Reflect's visualizations and Endgame's AI context layer, Alex Bilmes has spent his career turning scattered data into decisions people can actually use.

The Delhi Firm Doing the World's Data Homework
Blackcoffer turns messy enterprise data into dashboards and decisions for clients from consulting giants to a national central bank - 110 people, offices on three continents, and a name that doubles as a mission statement.
ThoughtSpot Is Teaching Business Intelligence to Answer Back
The company that made corporate data searchable is betting that the next dashboard will behave less like a report and more like a careful analyst - one that shows its work.
thorntale
thorntale (YC W24) is a San Francisco software company that built presentation tools for data storytelling. Instead of screenshotting charts from Looker or Snowflake into Google Slides, teams could connect live data sources directly into decks, so charts stayed interactive and up to date - even re-segmentable during a live Q&A. Founded in 2024 by data scientist Dori Wilson with engineers Ellen Hui and John Stimac, the company later pivoted toward an AI-powered presentation editor and shipped a free AI Presentation Review tool before winding the core Presentations product down at the end of 2025.

Grafana Labs
Grafana Labs is the company behind Grafana, the widely used open-source dashboarding and observability platform. Founded in 2014 to commercialize Torkel Odegaard's visualization tool, it has grown into a full-stack observability vendor built on a 'big tent' philosophy - letting teams unify metrics, logs, traces and profiles from any source without ripping out existing tools. Its LGTM stack (Loki, Grafana, Tempo, Mimir) plus Grafana Cloud and Grafana Enterprise now serve more than 7,000 paying organizations, including roughly 70% of the Fortune 50, with the business surpassing $400M in annual recurring revenue and a $6B valuation.

Nomic AI
Nomic AI is a New York-based artificial intelligence company building tools to make large, unstructured datasets and AI models understandable and usable by everyone. It is best known for Atlas, a browser-based platform for visualizing and interacting with massive datasets; the open-source Nomic Embed family of text, code, and multimodal embedding models; and GPT4All, an ecosystem for running large language models privately on everyday hardware. Since 2025 the company has focused its platform on the architecture, engineering, and construction (AEC) sector, applying its embedding and retrieval technology to drawing review, code compliance, and document-heavy construction workflows.

SEAD Software LLC
SEAD Software LLC is an Englewood Cliffs, New Jersey company that builds enterprise applications on Co-Wright, its proprietary low-code/no-code development platform. Combining full-stack development teams with drag-and-drop tooling, SEAD helps mid-sized businesses across finance, manufacturing, healthcare, supply chain, real estate and non-profits consolidate scattered data into a 'single portal of truth,' automate operations, and stand up custom, white-labeled applications at a fraction of the time and cost of traditional development.