The least glamorous part of a dashboard is usually the reason it exists. Someone exports a CSV. Someone else fixes a column. A third person asks IT to add one filter to a report, then waits. By the time the chart reaches a meeting, its numbers are already carrying a small history of human improvisation. InetSoft has been selling against that history since 1996.
The company was founded in Piscataway, New Jersey, by brothers Larry and Luke Liang, who arrived with unusually useful résumés for the moment. Larry had worked in research and mission-critical systems at Bellcore, Bell Labs, AT&T and Lucent. Luke had moved through technology and consulting roles at Goldman Sachs, JP Morgan and UBS. Java was new, corporate software needed ways to print and publish information, and the brothers chose the urgent, unsexy gap: reporting.
Their first product, Style Report, was a Java report-generation engine. It could sit inside desktop or web applications and turn data into formatted output. That origin still explains the company better than any fresh coat of cloud vocabulary. InetSoft has always been comfortable as infrastructure, including the kind customers never notice because another software vendor has embedded and rebranded it.
The chart was never the whole product
Today the platform is called StyleBI. It connects to databases, files, cloud services and APIs; lets users clean, join and transform those inputs; then produces interactive dashboards or tightly formatted, scheduled reports. The same machinery can run as a stand-alone BI environment or appear inside somebody else’s application. That last use is important. A school platform can give teachers student dashboards. An insurance product can add regulatory reports. A homebuilder tool can show cash forecasts without asking customers to buy a separate analytics system.
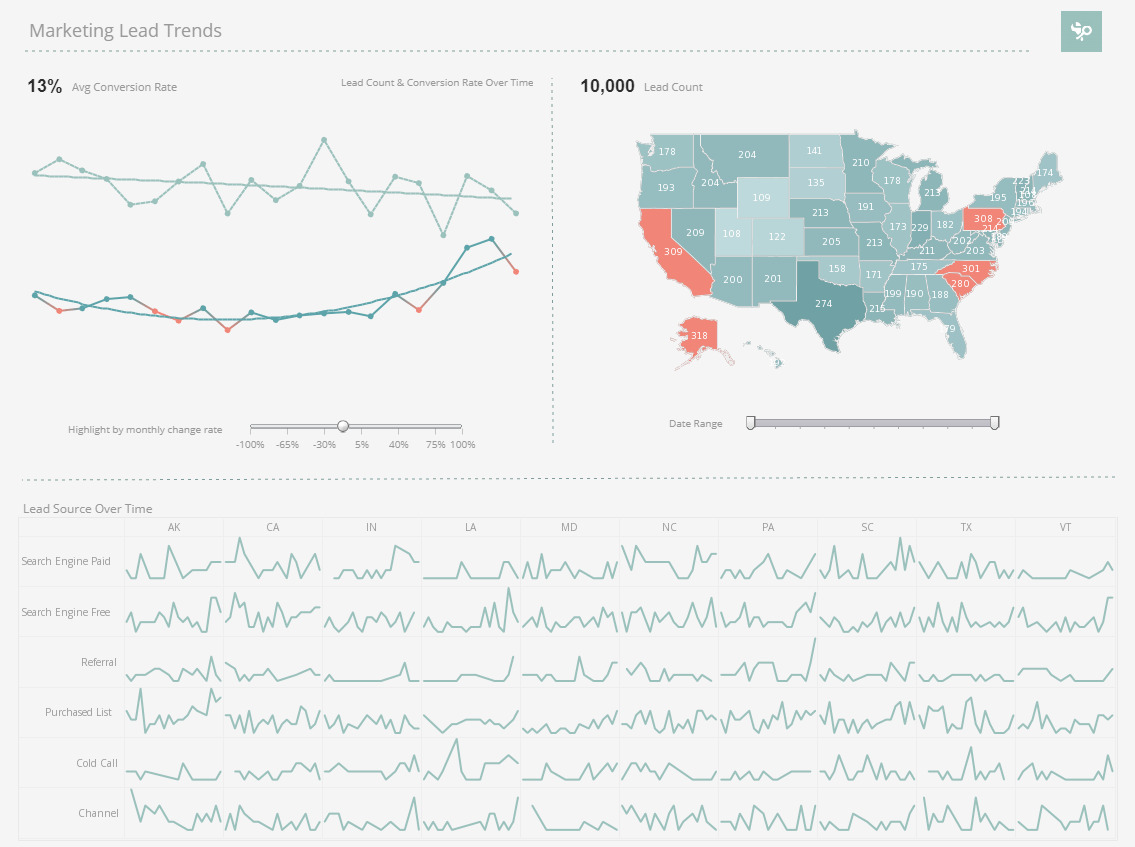
The distinctive piece is the data-mashup layer. InetSoft’s older name for its reusable query components was Data Blocks. The idea is that a business user or analyst can combine sanctioned data without writing a new back-end ETL pipeline for every question. The result can be shared, reused and governed inside the BI environment instead of escaping into a spreadsheet.
“Even a marketing guy like myself can write HR reports.”Mark Flaherty, InetSoft chief marketing officer, during a product webinar
That quip captures the promise and the risk. Self-service reduces the line outside IT, but it does not repeal arithmetic. Users can still choose the wrong field or invent a dubious formula. InetSoft’s sensible argument is not that people stop making mistakes. It is that they already manipulate data in Excel and slides, beyond any centralized control. Keeping that work in a reusable, permissioned environment gives the organization a better chance to see and correct it.
What failed first
Across InetSoft’s older customer accounts, the breaking point is rarely a dramatic system crash. It is an accumulation of small indignities. Data Solutions Inc., an HR software provider, had a proprietary reporting system that required data to be extracted from core applications. Customers wanted distinctive layouts and real-time reports, while development cycles dragged. After embedding Style Report, the company said average reports ran in about 20 seconds instead of two minutes.
A healthcare marketing-services firm hit a different wall. Its clients wanted on-demand analysis, but the incumbent reporting product was basic and an upgrade would have required buying a larger BI platform than the firm needed. InetSoft’s licensing and embeddability changed the calculation. The company reported that automated delivery rose from 50 percent to 95 percent of client information requests, leaving the exceptional work to one part-time analyst.
At Hillcrest Foodservice, the enemy was fragmentation: an AS/400, Access databases and information scattered across sales, purchasing, payroll, operations and receivables. InetSoft says one operations workflow alone saves more than 500 staff hours a year by automating the collection and analysis of order and shipment data. T-Formation, an apparel printer, found through its dashboards that some orders were not profitable at existing prices. That discovery changed pricing models and production planning. The dashboard mattered because it changed a decision, not because the bars were handsome.
The range of deployments also says something about the product’s job. New Zealand school-management system Assembly uses interactive dashboards and precisely formatted reports across more than 430 schools. PTAGIS, a fish-migration data system in the Pacific Northwest, gave field users web access to near-real-time reports on species, hatcheries and tagging anomalies. These are not adjacent industries, and that is the point. InetSoft is not selling a prewritten theory of food distribution, education or fisheries. It is selling the connective tissue between specialized operational data and the people who must act on it.
Three reported outcomes, normalized for the eye
The price is flexibility, not a sticker
InetSoft does not publish one simple enterprise price. The current offer has three doors: a free AGPL-licensed open-source edition, free cloud access for an individual, and commercial hosted or self-hosted editions sold according to deployment and enterprise requirements. Customers pay for the things that become expensive in real organizations: scale, support, multi-tenancy, auditing, security controls, hosting and integration help. Older customer accounts repeatedly describe flexible licensing, monthly subscriptions or the ability to start with a smaller deployment. One consultancy described getting started for only a few thousand dollars, but that is an anecdote, not a current rate card.
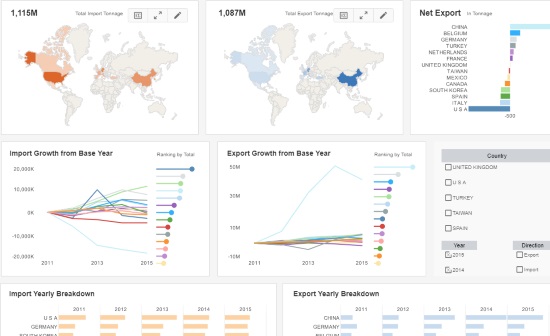
The model sharpens InetSoft’s market position. Microsoft Power BI and Tableau offer vast ecosystems, familiar talent pools and executive recognition. Qlik, Looker, Sisense, Cognos and SAP BusinessObjects bring their own strengths. InetSoft instead leans on a smaller footprint, deployment neutrality, production reporting and OEM integration. It is most interesting when the analytics must live inside an application, run on premises, mix operational data quickly or deliver pixel-perfect output as well as charts.
An old company tries an open trick
In March 2025, InetSoft launched StyleBI as a cloud-native microservice and opened the core under the AGPL-3.0 license. The public repository packages the application for Docker, recommends two cores and 8GB of memory for a basic cloud deployment, and documents builds with Java 21. The architecture separates data transformation and visualization into services that can run alone or inside a broader microservice system. Commercial editions add the controls large customers expect.
This is both modernization and distribution strategy. A developer can test the real application without waiting for procurement. A small team can self-host. An OEM can inspect the shape of the product before discussing a commercial agreement. For a company that once used Java’s portability as an opening, containers are a familiar kind of bet: make the software easier to put where customers already are.
Culture is harder to measure from the outside. InetSoft describes a casual environment with an honest exchange of ideas and respect for employees as individuals. The sturdier signal is continuity. The founding brothers remain chairman/chief architect and CEO; the product has followed a consistent line from reporting to web delivery, data mashups, embedded analytics and containers. This looks less like serial reinvention than the same engineering opinion translated across four generations of infrastructure.
What to copy, and when not to
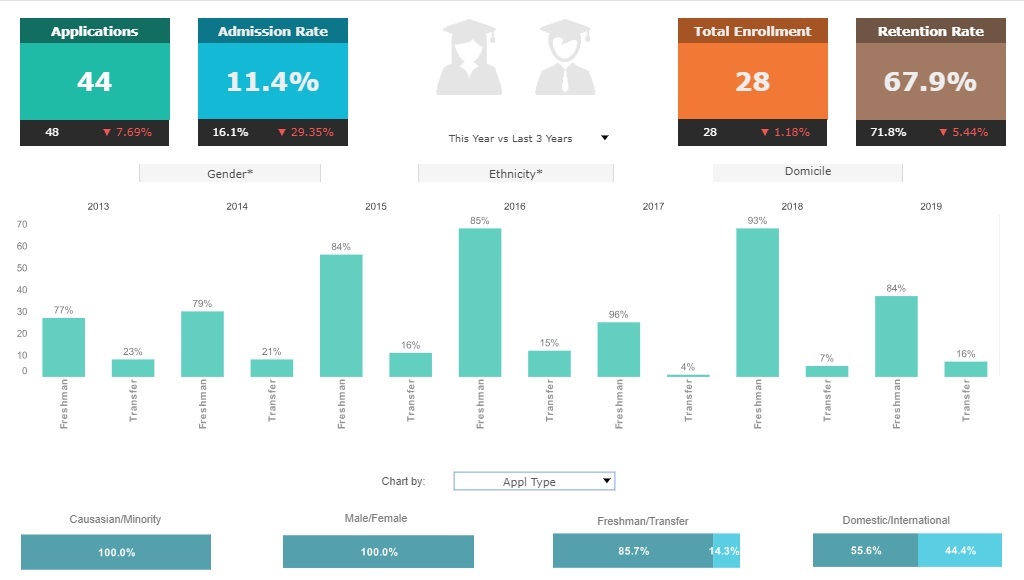
The copyable lesson is not “buy a dashboard.” Start with the expensive handoff. Find the report request that moves between a business person, an analyst and a developer every week. Count the exports, reconciliation steps, runtime and support tickets. Put one governed dataset and one decision into a pilot. Reuse the security already present in the host application. Let actual users change filters and layouts. Measure the wait removed, not the number of visualizations produced.
A small BI pilot that can survive contact with Monday
- Choose one recurring decision with a visible manual cost.
- Connect the sources without rebuilding the entire data estate.
- Agree on metric definitions before handing over self-service controls.
- Ship inside the workflow people already open each morning.
- Track time saved, error reduction, adoption and changed decisions.
It will not work everywhere. A tiny team with one spreadsheet and three charts may be happier with a lighter tool. A company that wants thousands of marketplace extensions or a huge pool of certified contractors may prefer a market leader. Self-hosting is a poor bargain without someone responsible for patching, backups and uptime. And data mashups become data anarchy when no one owns definitions, permissions or quality.
InetSoft’s longevity makes a narrower point. Business intelligence is not won once. Data moves, infrastructure changes and the person waiting for a report becomes less patient. The company survived by following that impatience from a Java print engine to a browser, through self-service data preparation, into other vendors’ products and now inside a container. The packaging changed. The queue was the product problem all along.