A road project usually begins with a plan for the road being dug up. The more expensive question concerns all the roads around it. Where will the cars go? What happens to the bus? How long can a crew keep working before the queue becomes a political event? On Ponsonby Road in Auckland, those questions helped turn a conventional 61-day traffic-management schedule into concentrated weekend closures. The software company in the room was Mooven.
- Mooven joins work schedules with live journey times, speeds, traffic counts, public transport data and alerts.
- Its customers include councils, transport agencies, contractors and engineering teams.
- The striking case is a change of method: measure a whole network, then choose a shorter way to build.
- Public plans start at $19 per user per month for project management and $29 for standard transport monitoring.
The company began in New Zealand in 2017. Co-founders Micah Gabriels, a product and commercial leader, and Paul McDonnell, a developer and technology leader, had been asking an ordinary traffic-jam question: why does construction take so long? Their answer was that project teams often had too little usable information to know when they could work, or how to respond when conditions changed. Caution filled the gap. Caution is prudent on a live road; it can also be remarkably expensive.
The calendar was the first thing to move
Auckland Transport wanted raised crossings and slower traffic at Ponsonby Road and Pompallier Terrace, a busy strip with shops, pedestrians and buses. The proposed traffic-management plan covered 61 days. A long, partial occupation of the street would have been familiar. It also meant many more hours with workers and drivers exposed to a changing work zone.
Mooven let the team examine traffic flows around the site, compare likely effects of closures and identify nearby businesses that would need warning. The revised method closed roads from Friday evening to Monday morning for two “super weekends,” with three additional nights. That was a construction choice made by Auckland Transport and its delivery partners, including Fulton Hogan. Mooven supplied the evidence and monitoring that helped them make and defend it.
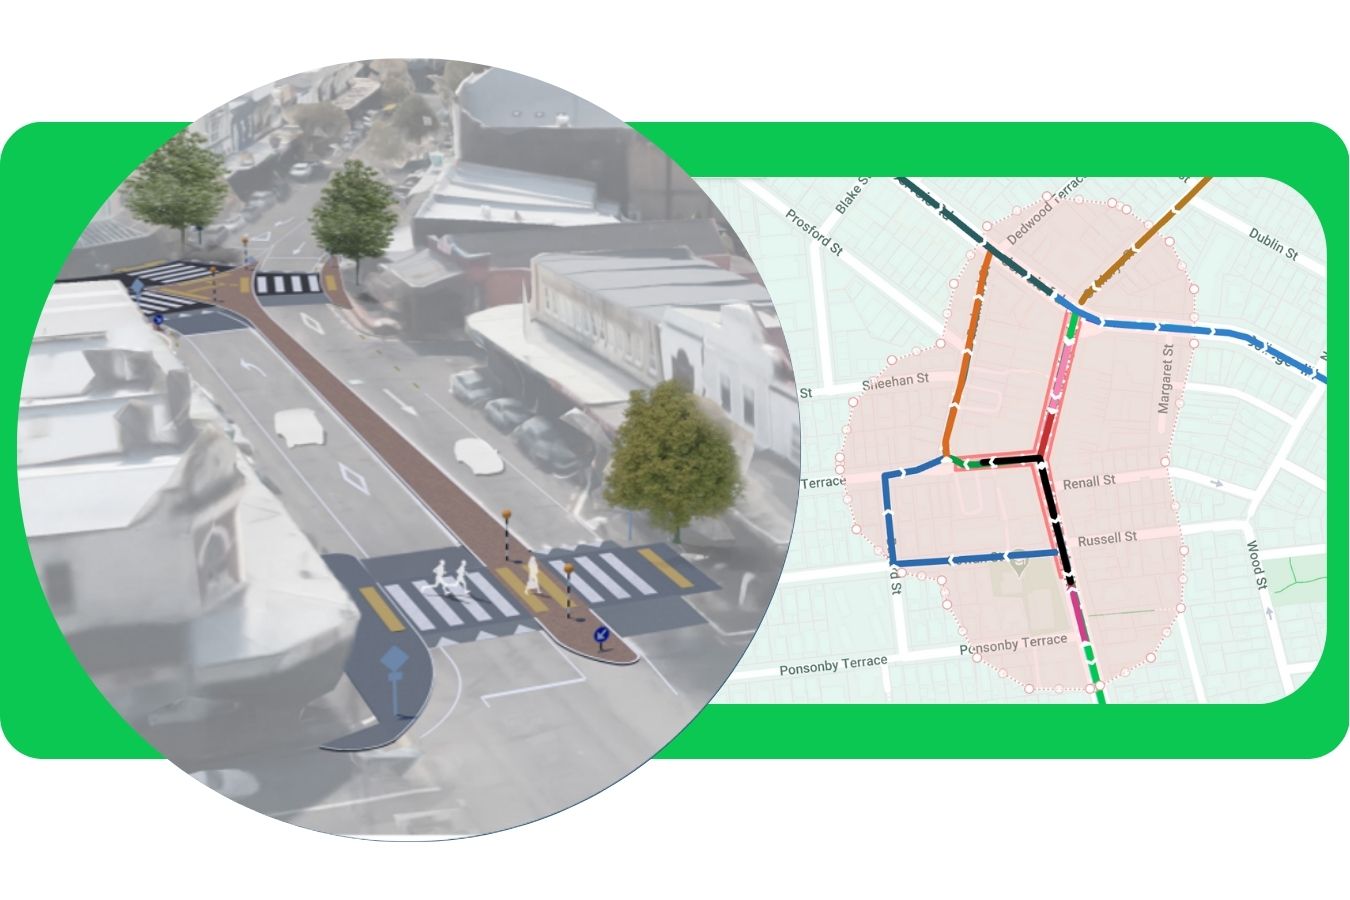
The published case study reports 455 planned active traffic-management hours falling to 83, and $279,000 saved on traffic management. It also reports an average speed reduction of 18% after the safety work, without a material increase in journey times during construction. These are results from one project, with a cooperative client, a workable closure window and substantial planning. They do not mean a dashboard can subtract nine weeks from every road job.
The useful unit of analysis was not the lane under repair. It was the whole neighborhood trying to get somewhere.What the Ponsonby method changed
What the software actually watches
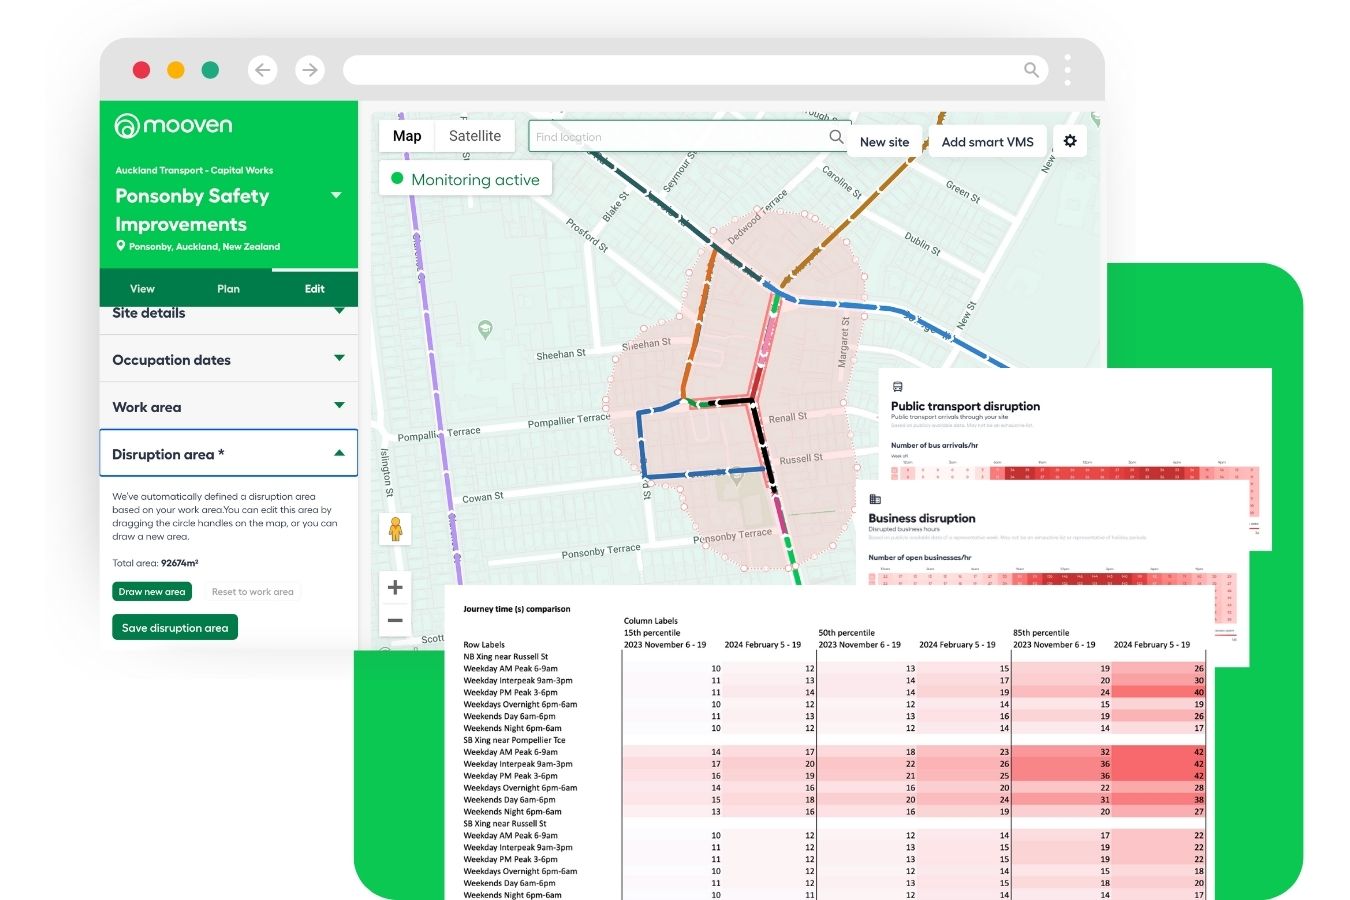
Mooven’s core product is transport monitoring. It shows journey times, speed, traffic volumes, queues, incidents and, where data is available, bus and other public-transport performance. Teams can compare a workday against a baseline from before construction. They can set alerts when delay or speed crosses a threshold, then see whether the problem began at their site or somewhere else on the network. A traffic count from a roadside tube, a signal system, a camera or a customer’s own files can sit beside floating-vehicle data. The product is useful precisely because no single sensor tells the whole story.
The other pieces are less glamorous and perhaps just as important. Project Management tracks programmes, shifts, crews, tasks and changes. The Operations Hub shows active work and live network performance to a control room. Community tools let teams inspect likely business and transit disruption, share a simplified view with stakeholders and send conditional messages to variable message signs. The result is a feedback loop between planning, the crew, the control room and the person approaching the detour.
A repeatable sequence; outcomes still depend on the site and the team.
Seventeen routes and six signs
The contrast with ordinary project-management software becomes clearer in Melbourne. WBHO Infrastructure expected ten weeks of work at the Princes Freeway-Forsyth Road interchange if traffic had to squeeze past the site. It wanted to close the work area fully and finish in five weeks. The objection was obvious: where would more than 100,000 daily vehicles go?
Mooven configured 17 baseline routes in two hours, according to its case study. WBHO and the transport department then agreed on rules for recommending detours based on live journey times and delay. Six roadside message boards carried the advice; four displayed dynamic detours and two showed trip times. The authority approved the full closure. WBHO reported completing the programme in five weeks, within budget and without complaints during the work. The striking technology was not simply a map. It was the link from measurement to an approved construction method to instructions a driver could use.
Other examples show smaller changes. Downer used live conditions on Auckland maintenance work to challenge old assumptions about working hours and reported finishing a Settlement Road closure three weeks earlier. Wellington Water used pre-construction monitoring while planning a constrained pipe project; when traffic concerns paused the work, its team could compare journey times before and during construction and resume after showing a limited delay. Here the first thing that failed was confidence, not asphalt. Evidence restored enough of it to keep crews moving.
A subscription against a very large bill
Mooven sells subscription software to the people responsible for roads, not to motorists. Its public pricing page lists Project Management Standard at $19 per user per month, Transport Monitoring Standard at $29 and Pro at $79. A $5 viewer tier is for sharing monitoring access; integrations and some contractor arrangements are quoted separately. Data availability varies by place and plan. The public prices do not disclose a typical agency contract or what a full project spends.
That matters when considering return on investment. The $279,000 Ponsonby saving belongs to Auckland Transport’s redesigned project, not to software acting alone. The software’s economic argument is that its price can be small beside traffic management, labor and public delay if better evidence creates room for a different method. The argument weakens when there is no safe alternative closure, poor data coverage, rigid permit conditions or no authority willing to change a plan. Those are operating constraints, not bugs that an AI label can solve.
Mooven sits between intelligent transport systems and construction management. A traditional traffic survey may tell a crew what happened last Tuesday. A generic project tool may know who is scheduled next Tuesday. Mooven’s pitch is to put both Tuesdays in one operating picture, then keep checking while the city behaves like a city: unpredictably. Its customers include councils, transport agencies, contractors and consultants; public case studies name Auckland Transport, Downer, WBHO, Georgiou and Wellington Water.

The transferable part
The company raised NZ$5 million in a 2021 Series A led by Equity Venture Partners, then announced a San Francisco office in 2022. It now describes teams across the United States, Australia and New Zealand. The scale-up question is whether the same habit of measurement can travel through different permit systems, traffic-data coverage and public expectations.
A reader does not need Mooven to copy the central discipline. Before choosing a roadwork schedule, measure the surrounding network; count the bus as well as the car; identify businesses that need a call; agree in advance what delay triggers a response; and compare the finished job with the baseline. The pleasure of the Ponsonby story is that its best result looks, at first, like less construction. In fact it was construction done with a better sense of everyone else’s time.