Brand managers have spent decades bringing adjectives to a spreadsheet fight. They know a company can feel familiar, dated, trustworthy or oddly cool. Finance wants to know which of those feelings will sell another shoe, hold a price increase or protect next quarter’s revenue. BERA’s entire business sits in that awkward pause between the two departments. The New York company continuously surveys consumers, scores their relationships with thousands of brands, then applies statistical and machine-learning models to show which perceptions are connected to business outcomes. In plain English: it tries to tell an executive not merely that the brand moved, but what moved it, which customers care and what the movement may be worth.
That is a narrower and more useful promise than “AI for marketing.” BERA is part tracker, part analytics platform and part consulting bench. Its Brand Explorer lets teams inspect more than 130 measures across over 5,000 brands and 200 sectors. Its Brand-to-Business work connects those measures to sales, revenue, pricing power or enterprise value. Audience tools turn the analysis into media segments. Ad testing and consulting close the loop. The customer is usually not a small business deciding on a logo. It is an enterprise with a research budget, historical performance data and enough internal politics to require evidence that can survive a board meeting.
A brand tracker with a forward gear
Traditional tracking often arrives as a quarterly snapshot: awareness rose, consideration slipped, everyone schedules another meeting. BERA surveys every week and matches its United States sample to the census. The frequency matters because prediction needs a time series. A team can look for the perception that changes before a sale changes, rather than placing two lines on a chart and admiring their companionship.
The core BERA score combines four ideas: Familiarity, Regard, Meaningfulness and Uniqueness. Each can be cut by audience, geography and time. A company may be familiar but easy to replace, or loved by existing customers yet invisible to everyone else. BERA then groups consumers along a relationship curve with labels no normal dashboard committee would approve: New, Dating, Love, Boredom and Divorce. Underneath the joke is a segmentation system. “Prospects” and “switchers” suggest opportunity; “rejecters” may be expensive to persuade; loyal customers call for a different message from people who have never heard of the brand.
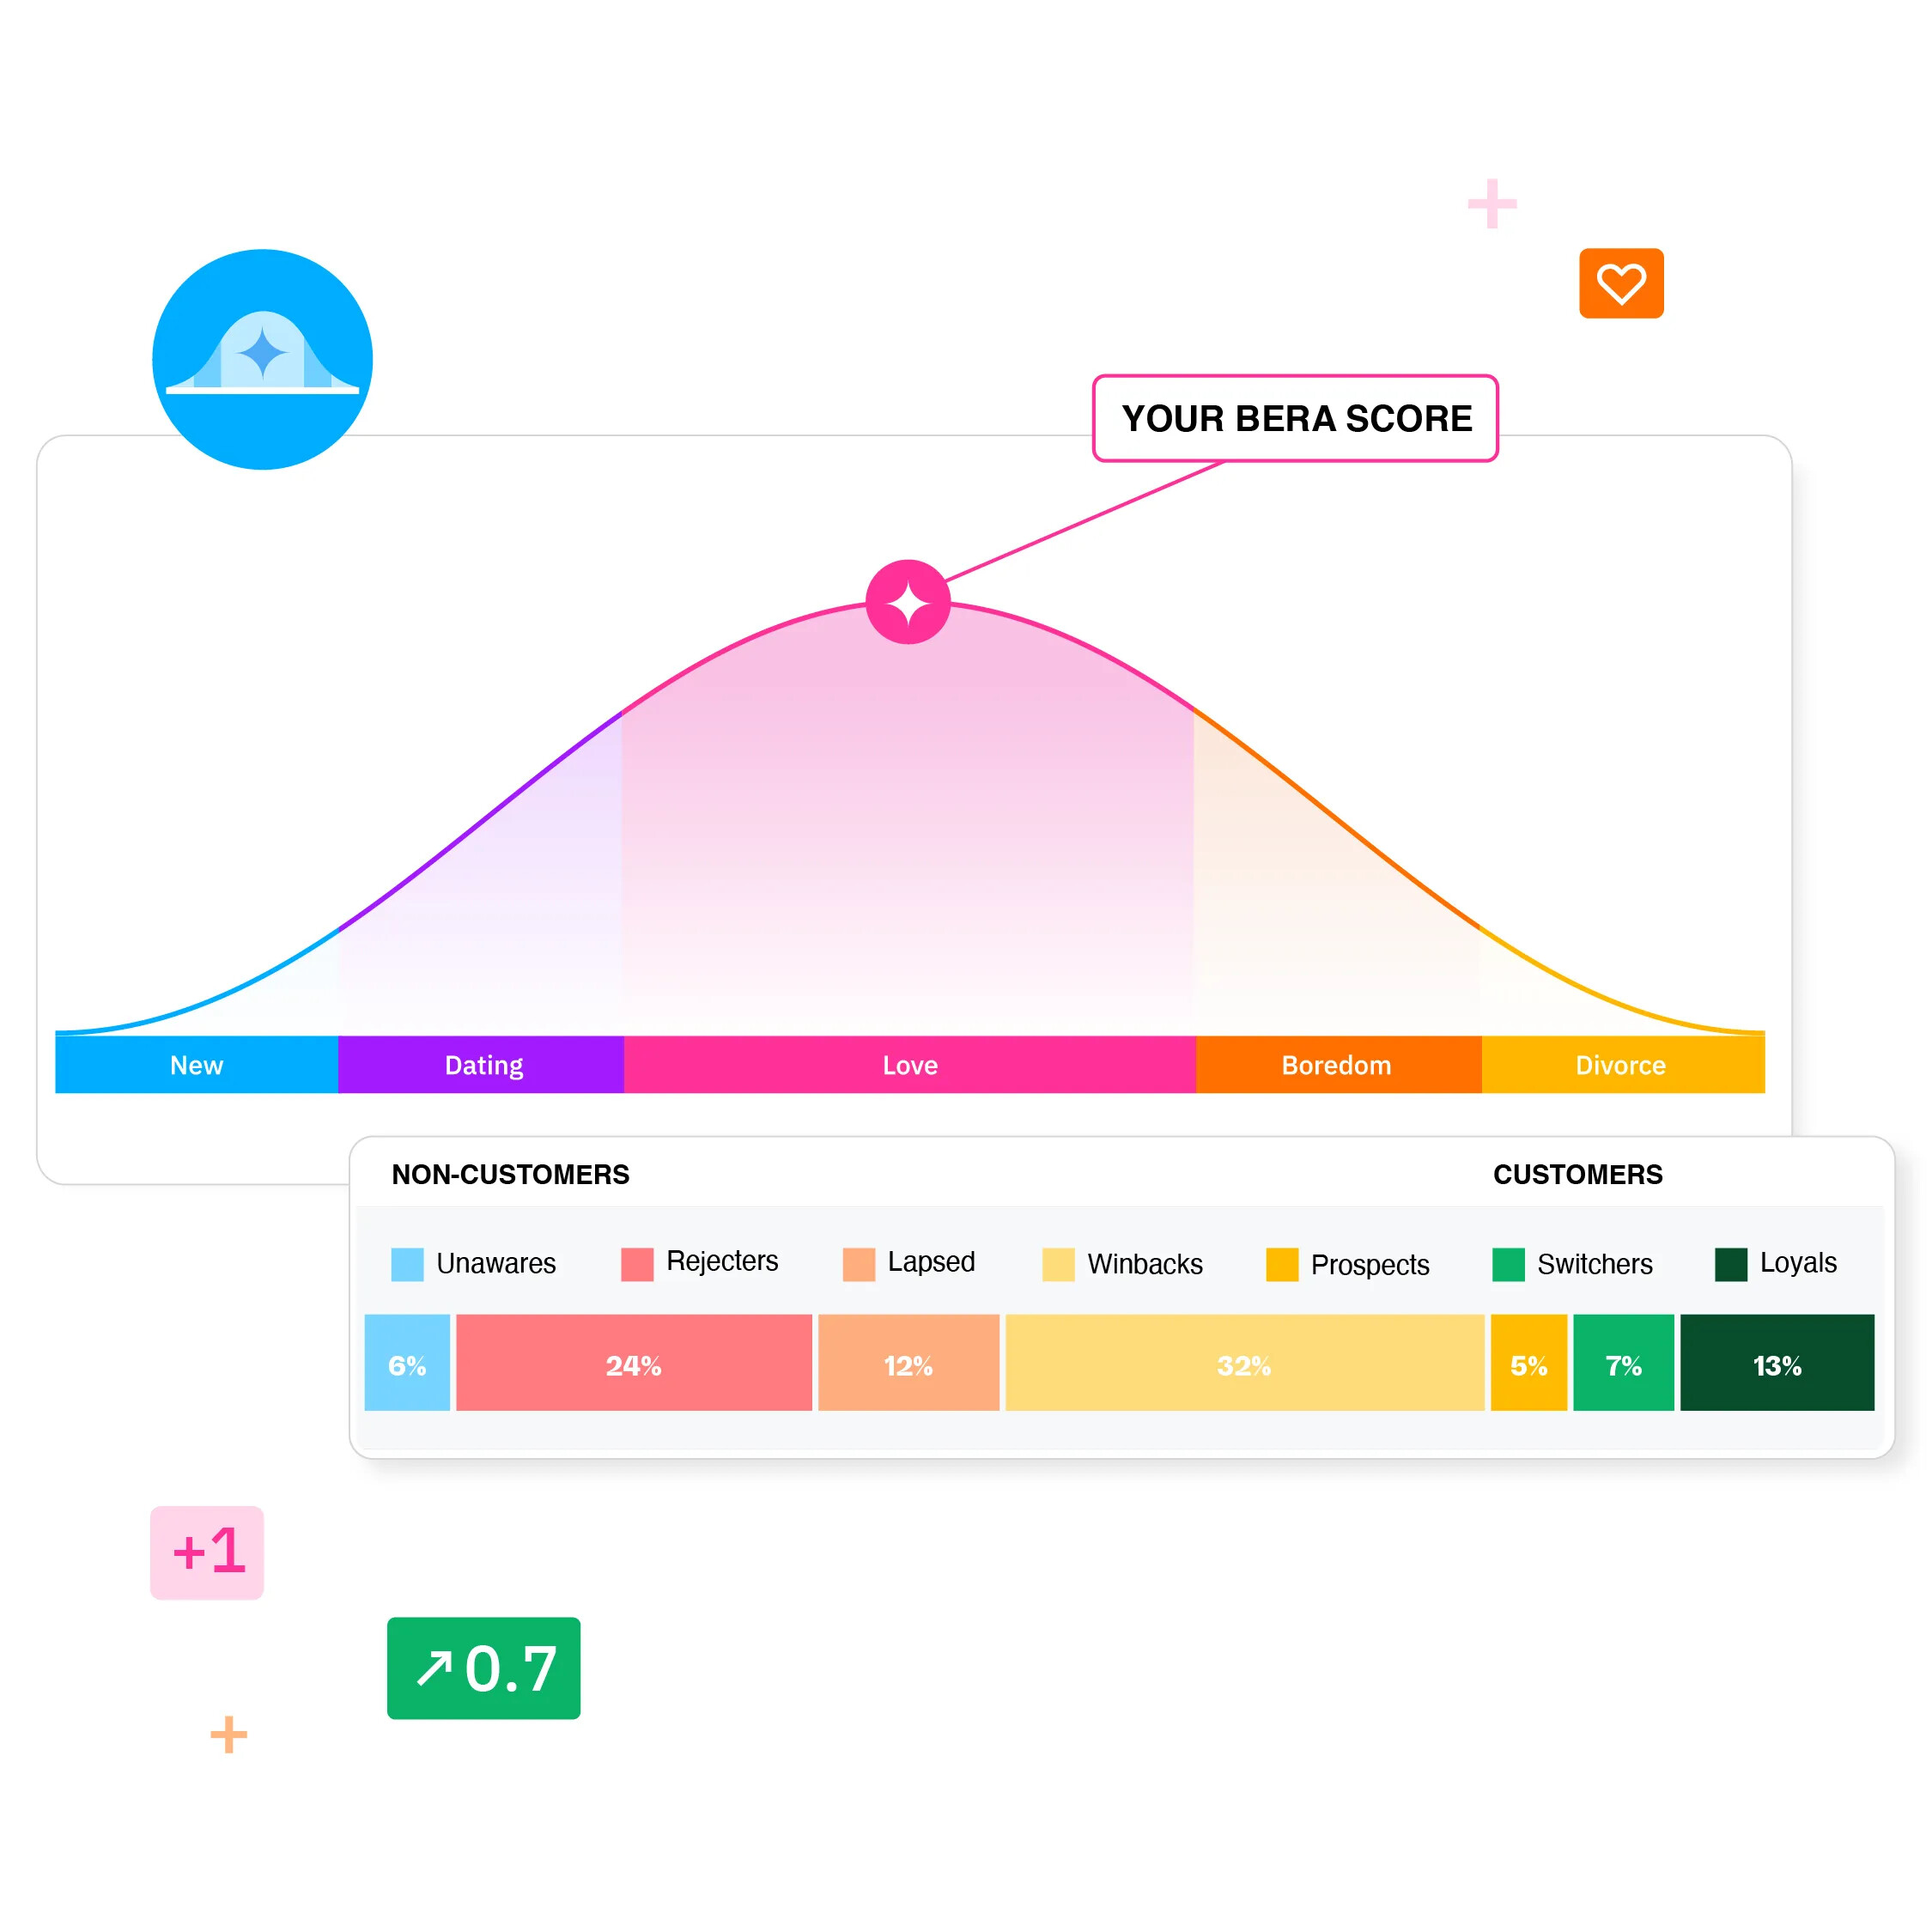
What customers can do with that view is practical: find an audience with room to grow, identify the attribute holding it back, test creative against that attribute, move the selected audience into a media platform and watch the score afterward. BERA’s 2021 agreement with Omnicom Media Group put its measures inside Omni, making the data available to teams at Hearts & Science, OMD and PHD. Shaina Boone, then chief analytics officer at PHD, said she could build a comprehensive view of a client and its customer perception in about two hours. The partnership was BERA’s first platform access for media agencies, and a clean demonstration of where it fits: between research and activation, rather than replacing either one.
DISH stopped leading with cheap
The most revealing public case begins with something failing. DISH had historically positioned itself around price. As satellite television faced streaming competition and a rough category reputation, low cost was not enough to create an emotional reason to stay. In early 2019 the company hired BERA as its brand-health tracker and worked with research firm MDRG to explore a stronger emotional position.
The research pushed the team toward trust, confidence, connection and belonging. DISH did not leave the insight trapped in a presentation. It created plain-language brand booklets for employees and outside partners, turning positioning into a piece of operating equipment. BERA’s ongoing measures then let the consumer-insights team watch a stubborn category perception improve among people considering the brand. The head of brand, one manager recalled, saw the chart and “his eyes just lit up.” The work earned DISH, BERA and MDRG a client-supplier collaboration award from Quirk’s.
“It’s given us a much richer understanding of what we know about ourselves and how we talk about ourselves.”Consumer insights manager, telecom case study
The useful lesson is not “measure more.” It is to connect research to a decision with an owner. DISH had an old position that had stopped carrying the load, a specific audience whose view needed to move, qualitative work that explained the emotion and weekly tracking that showed whether action changed perception. Take away the activation booklet or the organizational buy-in and the score becomes expensive wallpaper.
The price of proofThe $1.94 million asterisk
BERA does not publish list pricing. The best public cost window comes from a Total Economic Impact study that BERA commissioned from Forrester Consulting in 2022. Forrester interviewed executives at four user organizations, combined their experience into a composite global company with $10 billion in annual revenue, and modeled three years of costs and benefits. The model put risk-adjusted costs at $1.94 million, benefits at $9.54 million, net present value at $7.6 million and ROI at 391 percent, with payback in under six months.
Three-year composite economics
Costs - $1.94MThat final sentence matters. A composite is not a typical invoice and 391 percent is not a promise to the next buyer. The modeled benefits included faster attributable profit growth, removing overlapping research tools and improving marketing productivity. Those gains are most plausible at a large organization already paying for a patchwork of surveys, vendors and analysis. A smaller company without clean business KPIs, sufficient consumer sample or years of comparable data cannot simply purchase its way into a causal model. Nor can software rescue a team that collects a finding but lacks authority to change media, product, price or positioning.
The market mapNot just another dashboard
BERA competes on three fronts. Kantar, Ipsos and YouGov offer large research operations and established brand trackers. Platforms such as BlueOcean sell always-on brand intelligence. Inside many corporations, the real alternative is a home-built stack: survey vendor, BI dashboard, media-mix model and consultants stitched together by the insights team. BERA’s distinction is the packaged chain from syndicated perception data to financial modeling and audience activation, with advisers available when the software reaches the edge of a messy business question.
| Approach | Good at | Trade-off |
|---|---|---|
| BERA | Continuous brand data tied to audience and financial outcomes | Enterprise data, integration and budget requirements |
| Research incumbent | Custom studies, global panels and methodological depth | Can remain periodic and service-heavy |
| In-house stack | Control and company-specific data | Integration burden and weak external benchmarks |
The product is sold as enterprise SaaS plus services; exact contracts remain private. Funding helped it travel that path. In January 2020, PeakEquity Partners, former Procter & Gamble marketing chief Jim Stengel and the Jim Stengel Company made a $17.9 million growth investment. In July 2024, The Harris Poll, part of Stagwell, acquired BERA for an undisclosed sum and said the technology would strengthen Harris Quest, its suite of real-time research products. The deal gave BERA a larger distribution system and gave Harris a predictive layer beyond polling.
BERA has continued shipping under its own name. Brand Explorer now advertises more than 11 years of history. In 2025, the company won a SaaS Award for sales, marketing and CRM. In May 2026 it launched a Brand-to-Business AI Agent, which accepts an analysis request and returns a same-day, presentation-ready report. BERA says the synthesis that once took weeks or months can happen in less than an hour. The agent uses the company’s existing cross-sectional, time-series and media-mix methods; the new trick is delivery speed, not a new claim that a chatbot discovered causality.
The copyable partStart with the argument, not the algorithm
The most portable piece of BERA’s method costs nothing: decide which internal argument the research must settle. Is the question whether a brand lift leads sales, whether a price increase will hold, which audience can be won, or which attribute belongs in the next ad? Then choose a stable perception measure, a business KPI and a time window long enough to expose a lag. In one published luxury-apparel example, BERA found the strongest relationship when its overall score was shifted six months ahead of unit sales. That delay is precisely the kind of clue a quarterly campaign dashboard misses.
A five-line brand-to-business brief
- Name one decision the analysis will change.
- Pick a defined audience, not “everyone.”
- Track the same perception measure consistently.
- Pair it with a business KPI and test plausible time lags.
- Assign the person who can act when the signal moves.
There are conditions where this approach goes soft. New brands may lack enough history. Niche B2B companies may struggle to assemble a large consumer sample. A simultaneous price change, distribution expansion and celebrity campaign can make attribution slippery. Correlation can point to a useful lead indicator without proving that one variable caused the other. BERA’s advantage rises with scale, continuity and access to business data. Without those, a sharp qualitative study may be more honest than a glossy predictive number.
Still, the company has identified a real institutional itch. Brand teams no longer want a tracker that merely reports the weather. They want to know which lever to pull and how to defend the budget. Finance does not need to fall in love with the brand. It needs a model it can question. BERA’s contribution is to put both reactions on the same page - along with the sample, the lag and, if the meeting goes well, the money.
Keep exploring