Imagine running a restaurant where moving from one pricing category to the next can raise the menu by 6%-10%. You may need a modest adjustment. The system offers you a shove. This was one of the problems Denny’s faced with a pricing structure that had expanded from roughly 30 codes to more than 350. Precision had acquired an impressive number of labels without becoming especially precise.
- RMS helps restaurant brands price menus locally and understand store profitability.
- Its software comes with analysts, implementation support and consumer research.
- Denny’s and Tropical Smoothie Cafe show two different uses: better pricing and cleaner financial reporting.
- The useful lesson: test the decision, validate the data and distinguish an opportunity from a result.
Revenue Management Solutions, usually shortened to RMS, helped Denny’s replace that structure with restaurant-level pricing. The interesting part is the assumption underneath the change. A national brand can serve a recognizable breakfast while its restaurants face different customers, competitors and costs. The logo travels well. The economics are less obliging.
RMS has made a business of investigating those differences. It sells pricing software, financial analytics and research to restaurant brands and franchise operators. Its work begins where a system-wide average becomes a poor guide to what should happen at an individual store.
350 codes, and still too few answers
According to RMS’s Denny’s case study, the old codes grouped restaurants into pricing tiers. Rent and population density helped determine the groupings. Updating prices meant weeks of manual work, and adding codes made the structure harder to manage. By early 2023, leadership recognized that the restaurant network had outgrown it.
Denny’s already had a relationship with RMS stretching back more than a decade. In May 2023, it began implementing restaurant-level pricing through the technology RMS calls Price Studio. The case study describes replacing more than 350 codes over two years, supporting more than 1,400 restaurants and 230 franchisees.
The decision involved more than producing a clever recommendation. Franchisees needed understandable guidance and control. Prices needed to flow through business intelligence, menu design and the point-of-sale system. RMS even worked with the menu printer. Somewhere between an algorithm and a laminated breakfast menu sits a considerable amount of ordinary coordination.
The reported benefits concern speed, accuracy, local control and franchisee confidence. That is a useful account of a changed operating process. It does not establish a specific, independently measured profit gain for Denny’s.
A price must survive the trip to the till
Price Studio models pricing scenarios before they go live, helping operators examine potential changes in sales, traffic and margins. RMS says the platform combines transaction, loyalty, wage, competitor and market information. Pricing rules and approval safeguards help brands manage the results across locations.
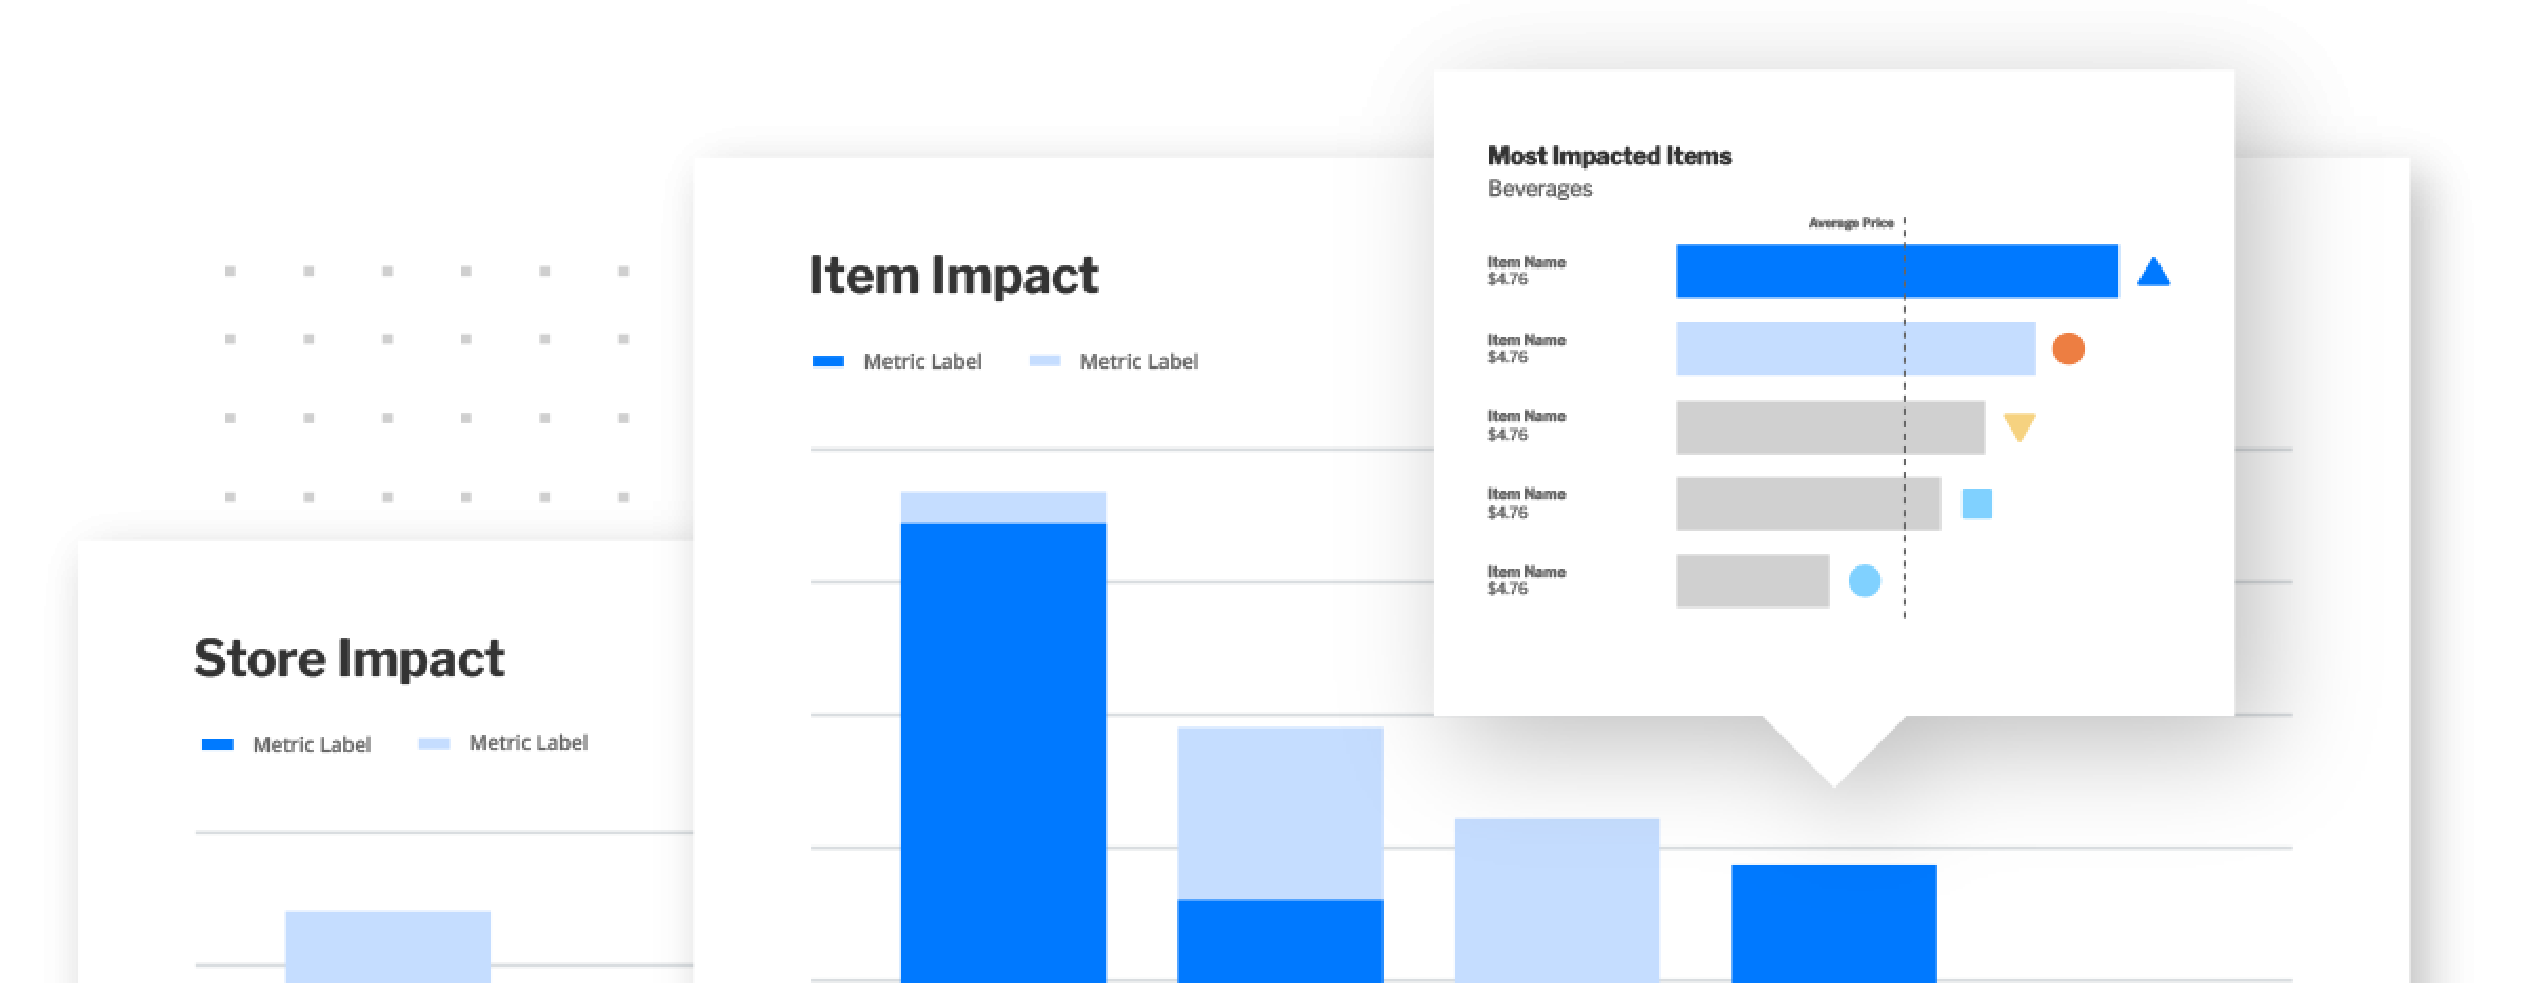
The company publicly unveiled Price Studio in March 2024. Its contemporary positioning pairs AI with human restaurant expertise. This matters because the commercial question is rarely as tidy as “What number maximizes revenue?” Operators also have to consider guest response, item substitutions, brand rules and the practical ability to implement a change.
RMS charges a one-time configuration fee and an annual licensing fee per location for Price Studio. metiRi, its financial reporting platform, follows the same structure. Both are sold through individual quotes. For a buyer, the economic test is whether better decisions and less administrative work justify configuration, recurring licenses and the effort of adoption.
A direct area of competition is restaurant pricing and margin management, where JUICER also operates. Internal analysts and spreadsheets offer another route. RMS’s distinguishing proposition is the combination of restaurant research, advisory work, local pricing and execution support. Buyers should judge that combination against their own decision workload.
The spreadsheet that could not be trusted
Tropical Smoothie Cafe had a different difficulty. Its finance team wanted to understand franchisee performance across a growing network. A previous third-party collection tool accepted financial statements, but RMS’s case study says roughly half the collected data was unusable because of accuracy problems. Other statements had to be gathered manually.
The initial failure happened before anyone could do meaningful analysis. Collecting a file and collecting comparable financial information had turned out to be two different accomplishments.
metiRi accepts financial uploads from existing accounting systems, using an initial template setup and validation at submission. Corporate teams and franchisees can then compare sales, labor, cost of sales and EBITDA. The April 2026 deployment announcement covered more than 1,700 U.S. Tropical Smoothie Cafe locations.
- 01SubmitExisting accounting files
- 02ValidateCatch errors at collection
- 03CompareBenchmark suitable peers
- 04ActCoach, investigate, improve
RMS reports a 44% increase in what it calls intentional and accurate system-wide reporting, and 100 previously blocked P&Ls successfully submitted. Those are vendor-reported results. Their significance is refreshingly concrete: information became usable, and more of it could enter the system.
Another RMS case study, involving an unnamed quick-service franchise, describes staged adoption: corporate stores first, larger accounting groups next, smaller franchisees last. Within six months, more than half the financial reports arrived within 30 days of period end. It also identified 3.9% controllable profit-margin improvement opportunities. “Identified” is doing essential work in that sentence. An opportunity still needs someone to act.
A menu can win attention and lose money
RMS also studies the choices diners make before a transaction exists. Conjoint analysis presents choices among products, prices and bundles. This can inform a new item’s pricing when there is no historical sales record. Menu engineering examines item performance and layout, including eye-tracking research that shows what guests notice.
One study makes the method more interesting than a simple sales pitch. An unnamed quick-service franchise with more than 5,000 locations wanted to improve average check and visibility for promotional items. RMS compared its existing menu with two refreshed designs, surveying 203 guests using webcam-based eye tracking.
More add-ons. A slightly smaller check.
The mixed result in RMS’s three-menu eye-tracking study
Guests tended to look at the top and center, overlooking lower sections. The refreshed layouts produced more add-on selections, particularly smaller individual entrees, but slightly lower average checks. The findings supported recommendations about placement, images and visual cues. They also demonstrated why attention alone cannot settle a profitability question.
A reader can copy the discipline without copying the entire technology stack: decide what outcome matters before testing a design. Measure that outcome alongside the appealing secondary effects. More items ordered may be useful; it still deserves a conversation with the revenue number.
The people between the model and the menu
RMS began in 1994 with co-founder Tom Kelly, whose background included hospitality operations and university teaching. John Oakes joined as a programmer in 2002 and became CEO in 2017. The company’s history places restaurant experience and technology in the same room rather neatly.

RMS now reports supporting more than 150,000 locations, over 50 restaurant brands and more than 40 countries. Its Competitor Price Intelligence product has a separate coverage measure: more than 235,000 restaurant locations across 120-plus brands and 13 countries. Coverage of competitors and locations served are different counts.
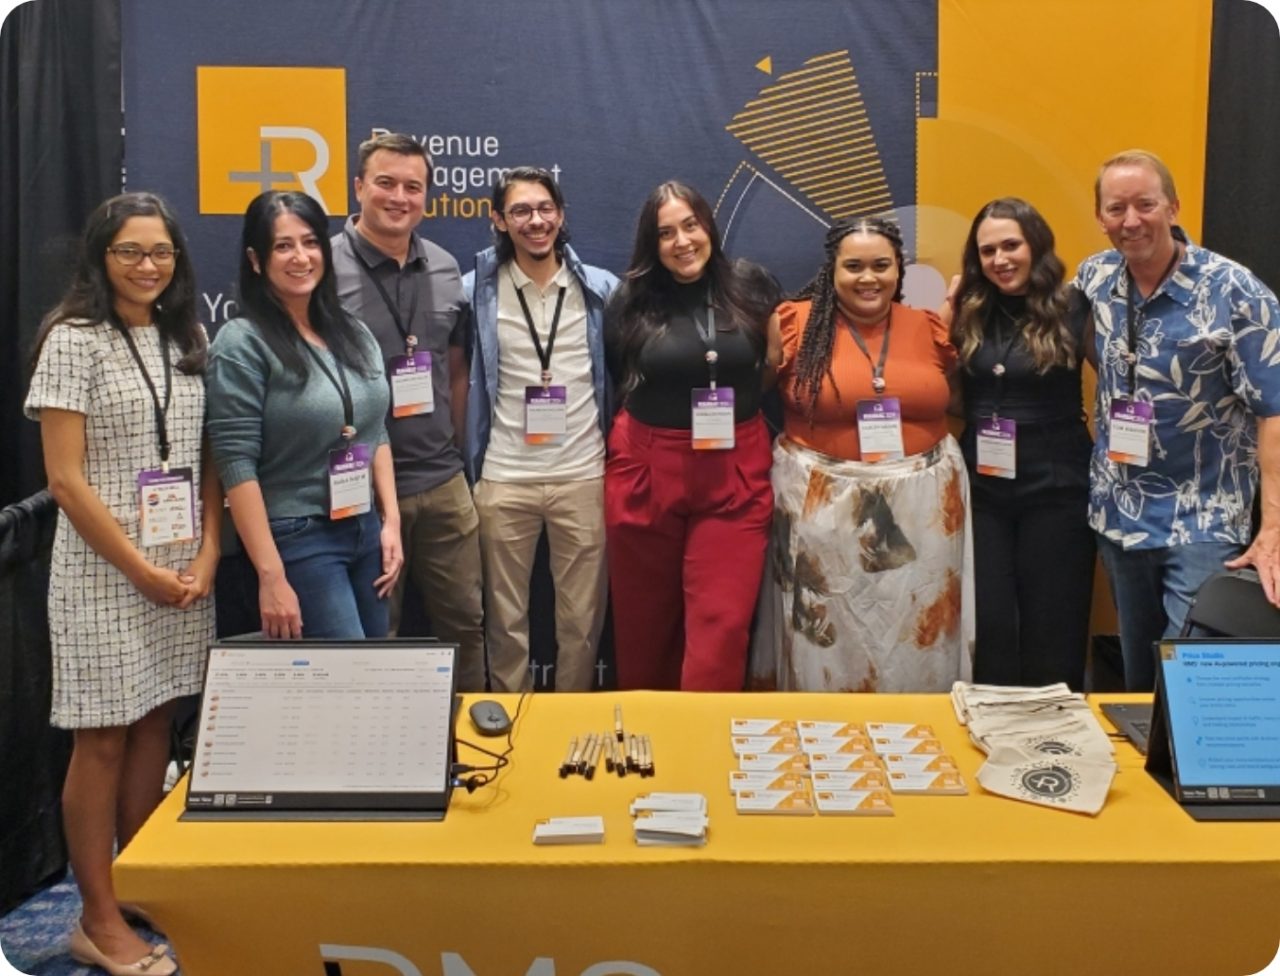
The research ecosystem includes listed partners such as iMotions and Qualtrics, alongside academic institutions. Its careers material describes collaboration and professional learning. Team photographs document conferences, social gatherings and community activities. Those company-published glimpses suit a business whose recommendations still need to be explained to people.
Small gains, with a very large denominator
The current market offers little comfort to indiscriminate price increases. RMS’s September 2026 report, covering August, recorded average QSR prices up 2.6% year over year while traffic fell 3.5% and net sales declined 0.6% in its dataset. Guests ordered 0.4% fewer items per transaction. Raising the number on the menu had not overcome the changes in visits and baskets.
Higher prices, fewer visits
Year-over-year changes. Bars share a scale of 8 percentage points across their full width; the center line is zero.
RMS’s September writing urges operators to diagnose traffic and average check separately, then test changes in selected locations. It also argues for small, repeatable improvements in menu contribution, costs and unit economics. A restaurant network gives a small improvement plenty of places to repeat itself.
There are practical conditions attached. Financial benchmarks need comparable inputs. Pricing scenarios need testing against actual guest behavior. Franchisees need a process they can use. A survey choice can inform a launch, but it is not a completed purchase. Software cannot make those distinctions disappear.
That is what makes RMS worth examining beyond the restaurant trade. The transferable idea is to notice when an average has stopped helping you decide. Denny’s did not need its 351st pricing code. It needed an answer at the restaurant where the guest was about to order.