A sale appears in three dashboards and, with impressive confidence, all three channels claim they caused it. Search caught the click. Social remembers an impression. An affiliate placed a cookie. The customer, meanwhile, may already have wanted the product. This is the small absurdity underneath a very large industry, and it is the reason LiftLab exists.
Founded in Oakland in 2018 by John Wallace and Bala Kandula, LiftLab sells measurement software and marketing-science support to companies with enough channels, stores and budget lines to make the truth expensive. Its users include the people who must defend that spending from opposite sides of the table: CMOs hunting growth, performance teams watching efficiency and CFOs asking whether marketing caused the result at all. Named customers in company material include SKIMS, Cinemark, Pandora, Quicken, Thrive Market, Tory Burch and Sephora.
The useful disagreementSKIMS had a hunch. LiftLab built a control group.
SKIMS believed TikTok could reach the right customer, but belief is a flimsy budget memo. So LiftLab helped divide the country into statistically matched markets. TikTok ads ran in the treatment regions and were withheld in the controls. Six weeks later, the experiment attributed a 2.9 percent lift in daily revenue and a 1.7 percent lift in daily profit to the channel, with 95 percent confidence in the incremental return estimate.
The interesting part was not simply that TikTok worked. LiftLab mapped a diminishing-returns curve and concluded that SKIMS had room to raise daily spending 3.4 times before reaching maximum profit. The experiment changed a tentative opinion into an executable number. It also supplies LiftLab with its favorite kind of sales proof: evidence that occasionally tells the customer to spend more.
A different customer got the opposite answer. An international software company was buying Google ads against its own brand name and holding an 85 to 90 percent impression share. LiftLab tested normal spend, reduced spend and doubled-down spend across geographies. The resulting curve put peak daily spend around $2,108. The company cut branded-search spending 87 percent, accepted a roughly 2 percent decline in orders and reported a 3.5 percent profit increase.
A channel can cause real lift and still be a bad home for the next dollar.The distinction at the center of LiftLab's product
What failed firstThe 70-cent result survived. The assumption around it did not.
Wallace tells a cautionary story about an advertiser that initially did the sensible thing. An incrementality test showed 70 cents of revenue for each advertising dollar. The company scaled the channel almost eight-fold, treating the result as if it were a permanent exchange rate. But ad inventory is not infinite and audience quality does not remain fixed. As spending climbed, the cheap, responsive prospects ran out first.
A later diminishing-returns analysis suggested the advertiser could remove roughly 80 percent of that channel's spend while changing revenue by only 1 percent. What changed the decision was not a new belief about whether the ads worked. It was a better question about how performance changed at the margin. Average ROAS describes the whole pool. Marginal ROAS asks what the last dollar returned. A healthy average can conceal a wasteful edge.
The curve hiding behind an average
Early dollars find the easiest customers. Later dollars buy progressively weaker inventory. The orange point is where another dollar stops helping profit.
The machineFour instruments, running on three clocks
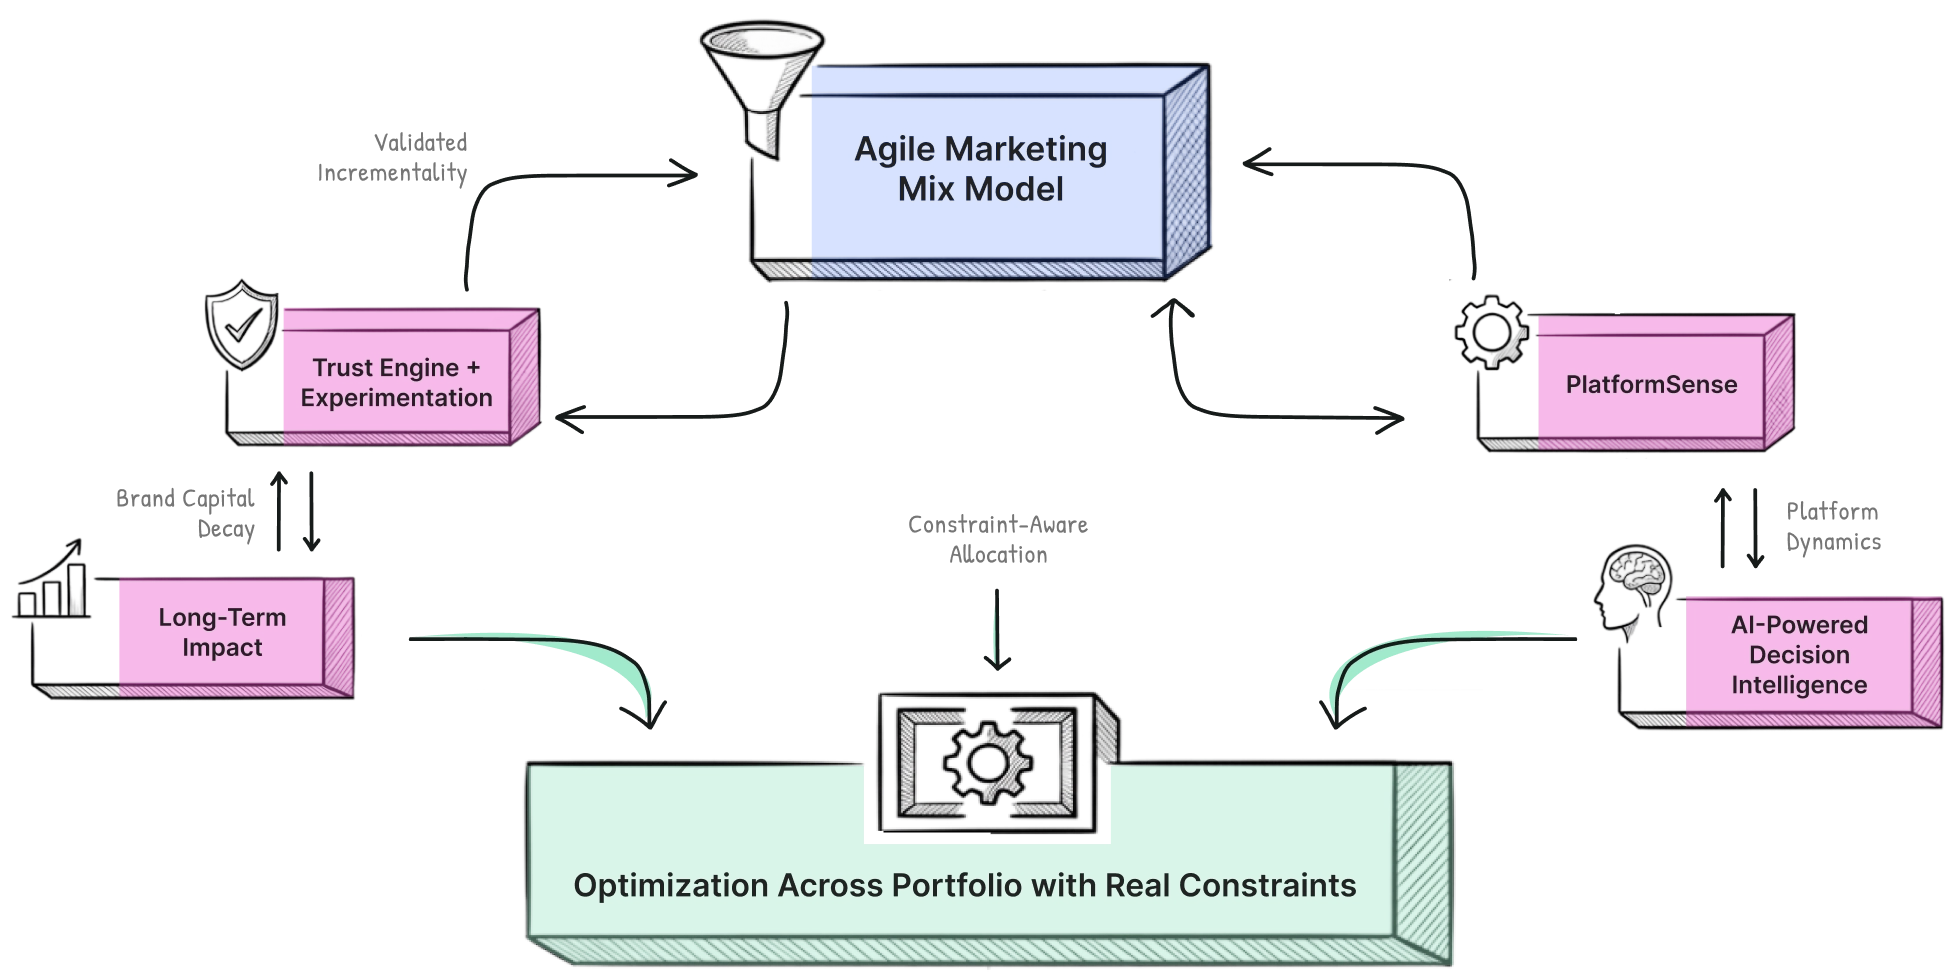
LiftLab is best understood as a loop, not a single score. First, its Agile Marketing Mix Model uses a two-stage architecture to separate auction economics, such as changing media costs, from consumer response. That produces response curves for the wider media portfolio. Second, its Trust Engine uses geo holdouts and other experiments to challenge uncertain parts of the model. Those causal results feed back into the curves instead of dying in a presentation deck.
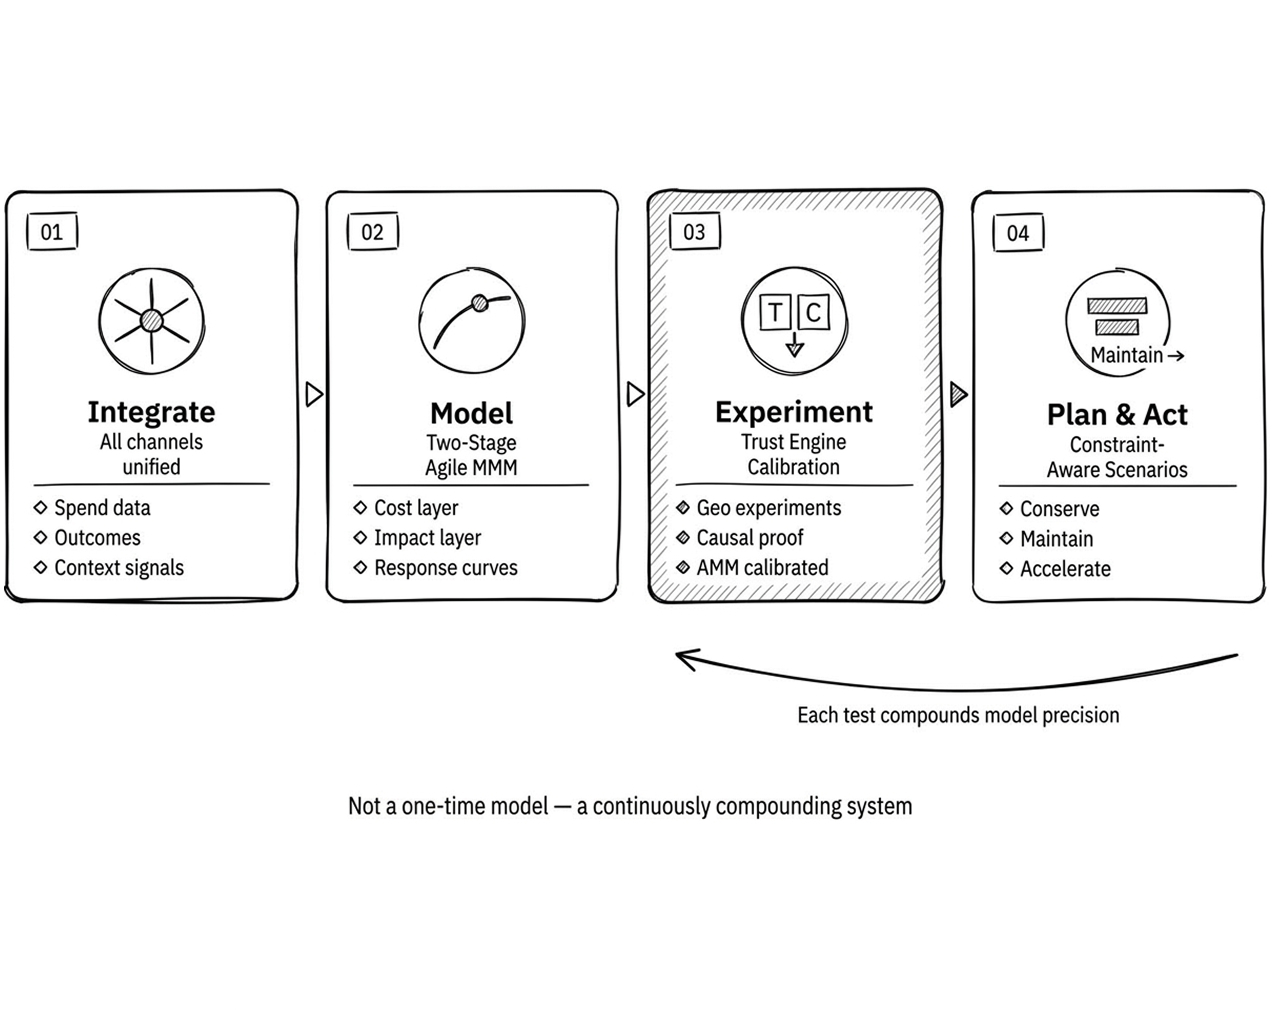
Third, the Scenario Planner turns the curves into conserve, maintain and accelerate plans. It accounts for the annoying facts that make theoretical optimization useless: television commitments, channel minimums, pacing rules and customer-acquisition ceilings. Fourth, PlatformSense, launched in 2026, pulls daily signals from more than 70 ad platforms. Click-through rates, conversion rates, costs and impression share adjust current channel elasticity through bounded modifiers without rebuilding the long-run model every morning.
That creates three clocks. Platform signals move daily. Budget decisions happen weekly. Brand effects can accumulate for six to 52 weeks. LiftLab's long-term module applies research-calibrated multipliers so upper-funnel activity is not judged only by conversions visible this month. The ambition is to put short-term performance and the net present value of brand investment on the same financial page.
Where it competesLess dashboard, more capital-allocation meeting
The marketing-measurement market is crowded with attribution dashboards, specialist experiment platforms, modern MMM software and large consulting engagements. Measured, Recast, Haus, Northbeam, Fospha and Rockerbox approach overlapping parts of the problem. LiftLab's distinction is architectural and operational: modeling, experimentation, daily intelligence, long-term effects and constrained planning live in one system, with marketing scientists alongside it.
Ad dashboards
Fast and granular, but the platform assigns credit to itself and sees only its own garden.
Traditional MMM
Broad and statistically grounded, but often delivered after the useful decision has passed.
Experiment tools
Strong on causality at one spend level, but incomplete without portfolio context and repeated testing.
LiftLab's wager
Use each method for its proper job, then connect the answers to a budget that respects reality.
Cinemark shows why the operating cadence matters. A cinema chain's demand moves with the release calendar; the media mix cannot wait politely for a quarterly report. Using LiftLab's marginal-return curves and ongoing tests, Cinemark expanded from seven measured channels to 13 in under three years and reallocated spend weekly. Pandora reported a 9.5 percent revenue lift and 12.4 percent profit lift after shifting only 2 percent of budget across key channels. Quicken reported 19 percent gross-revenue lift during a year-end window while maintaining overall incremental ROAS.
These are company-published case studies, not universal constants. Geo tests depend on comparable markets, clean enough outcome data and control groups that do not leak. A small advertiser with erratic spend may not generate a stable model. A national campaign that cannot be withheld anywhere may not permit a credible holdout. And a company with every dollar locked months ahead can discover a better allocation without having the freedom to use it.
The part a reader can copy before buying software
- Write the decision first: raise, cap, cut or move a specific budget.
- Separate average return from the return on the next dollar.
- Choose a channel whose uncertainty could materially change that decision.
- Test more than one spend level and set the stopping rule in advance.
- Feed the result into the next plan instead of filing it as an interesting report.
The tellAn inconclusive slide can be a product feature
At a LiftLab customer forum in New York in May 2026, a presenter asked how many people had received a first MMM in which every channel performed exactly as expected. No hands went up. Later, the company put an inconclusive experiment on screen. The treatment and control regions diverged, but not enough to reach statistical significance. LiftLab said so, in a room full of customers and prospects.
That moment clarifies the real product. The software is a collection of models, experiments and forecasts, and the business model is enterprise SaaS with expert service; public pricing is not listed. But the thing being sold is permission to change a budget without pretending the evidence is cleaner than it is. Sometimes the answer is 3.4 times more. Sometimes it is 87 percent less. Occasionally, the honest answer is that the test did not know.
For a marketing department, that restraint can feel almost radical. The old game asked which channel gets the trophy. LiftLab is trying to run a harder game: identify the counterfactual, locate the bend in the curve and bring Finance a choice among outcomes. The payoff is not prettier attribution. It is knowing what to do on Monday.