Barchart is the rare internet company whose origin story can be explained by a customer asking for the furniture. In 1995, when a live futures quote on a web page still felt like contraband from a trading floor, Barchart.com launched as a subscription service. People came for market data. Then companies asked a more consequential question: could they put those quotes, charts and tables on their own websites?
That request changed the shape of the business. Barchart built widgets, modules and private-label products, then kept moving down the stack into APIs, streaming feeds, software and managed digital experiences. The website remained. The data began traveling.
Today the Chicago company has two faces that share the same nervous system. Barchart.com is a retail market destination, reporting more than 4 million active users and 40 million page views a month. Barchart Solutions is the institutional side: the pipes and workspaces used by financial firms, media companies, fintech apps, commodity traders, food businesses and agribusinesses. One side makes the company visible. The other makes it embedded.
A chart is the front door. The messy data work is the house.
The consumer product is recognizable: stock quotes, futures, options, screeners, watchlists, news, technical studies and interactive charts. The enterprise product is less photogenic and more valuable. Exchanges and other sources send data in different formats, on different schedules, under different permissions. Someone must normalize symbols, preserve history, handle corrections, manage entitlements and keep the stream alive when markets get interesting.
Barchart packages that labor several ways. A developer can call an OnDemand API. A trading product can take a real-time stream. A publisher can commission a hosted financial site or embed interactive charting. An institution can receive standardized historical exchange files through Market Replay Enterprise. An analyst can bring the data into Excel, Tableau or Power BI.
“Data is who we are.”Mark Haraburda, CEO
The phrase is useful because it refuses the more flattering but less accurate label of “financial media company.” Media is a distribution layer here. The core competency is turning many untidy feeds into something another business can safely put in front of a customer or inside a risk model.
How the information moves
weather
physical markets
permission
store
stream
software
hedge
publish
Then the soybean chart walked into the grain elevator
Barchart becomes more distinctive in commodities, where a price is only the beginning of the job. A grain merchandiser may need the futures market, a local cash bid, a county yield estimate, weather, a grower's offer, a contract, a hedge and an accounting record. These are not separate curiosities. They are steps in one commercial decision.
cmdtyView is Barchart's attempt to keep those steps in one place. The browser platform covers global futures and options, thousands of physical markets, forward curves, economic and fundamental data, research, news, bid and offer management, hedge analytics and trading. Marketplace Apps give agribusinesses a branded channel to their growers. producerView handles the relationship record. Integrations pass contracts and scale tickets into established grain-accounting systems.
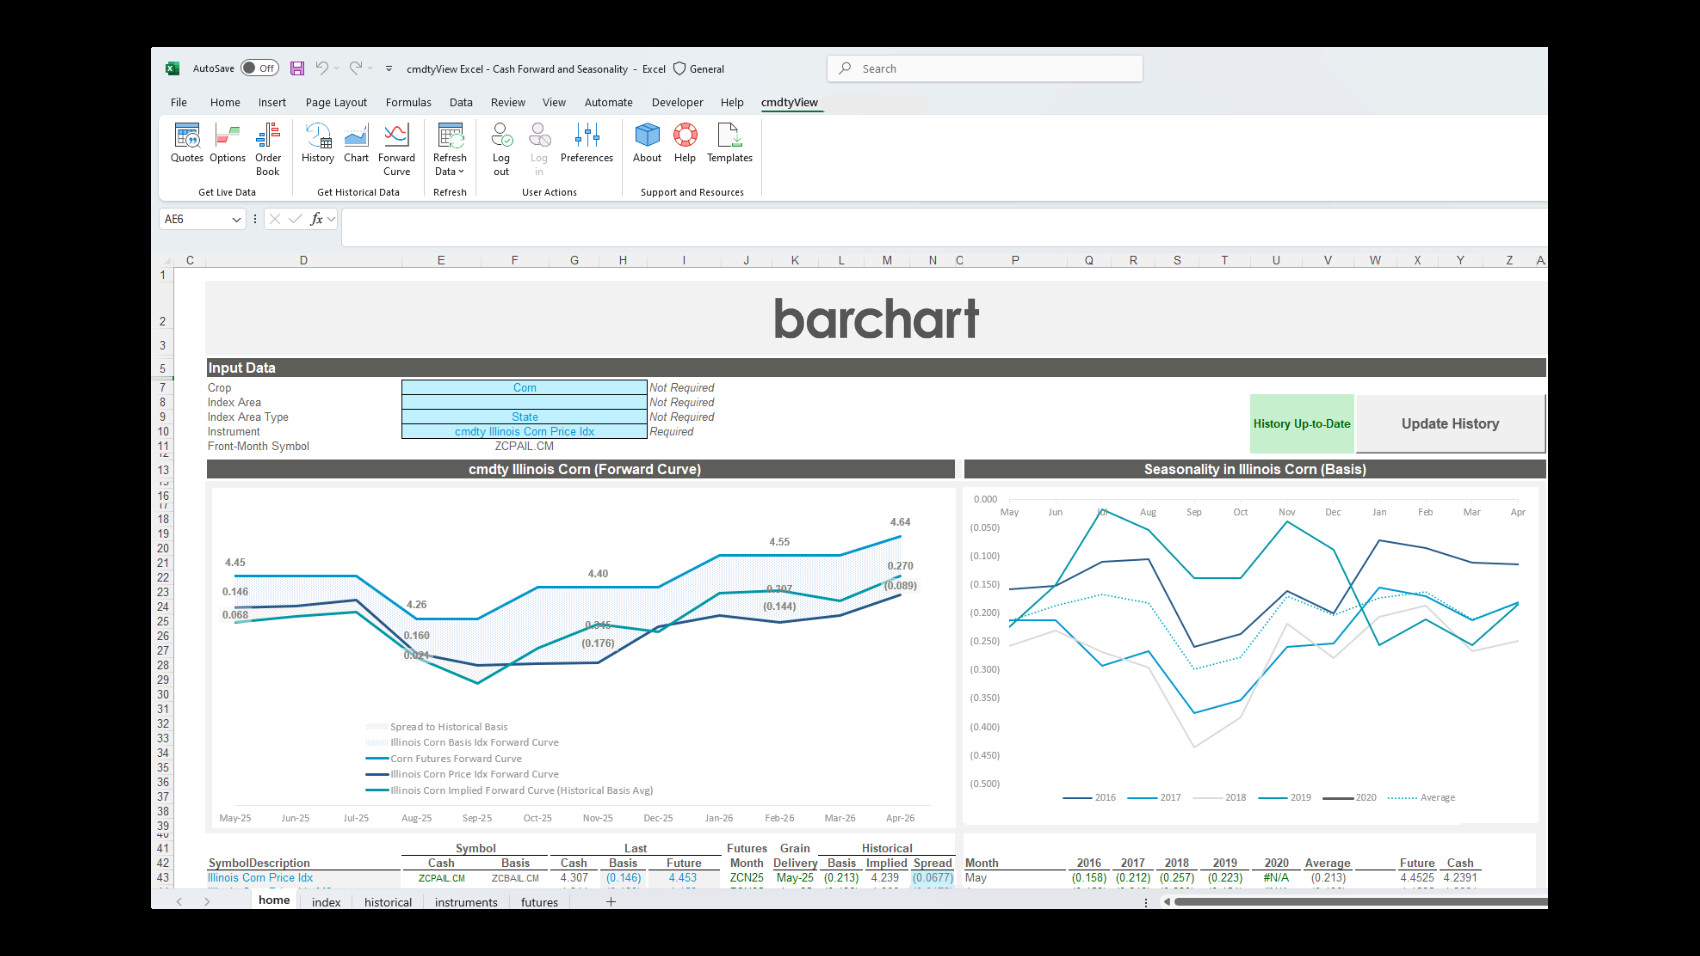
This is where Barchart differs from a broad financial terminal or a prettier charting app. It connects exchange data to the physical market and then to the work: communicate with a producer, make an offer, issue the contract, place the hedge, update the CRM. Marketplace Apps won the AgTech Breakthrough award four years in a row through 2025, less for inventing a dazzling interface than for joining a supply chain still full of phone calls and disconnected systems.
The customer list makes the breadth less abstract. The Globe and Mail has used Barchart for financial tools. TraderVue uses its market data for trading analytics and charts. Rosenblatt Securities describes using Market Replay to backtest strategies. Simplifi by Quicken uses the APIs for investing data. In commodities, Barchart publishes cases involving a cooperative streamlining grain operations, an energy-data provider serving its own clients, and a frozen-bakery business improving commodity risk management. The common thread is not company size or industry. It is the need to turn an outside market signal into an inside operating decision.
For a small product team, that may mean avoiding a home-built quote service and shipping a chart in days. BayStreet.ca said it deployed Barchart interactive charting within days, gaining more than 100 technical indicators, multiple plot types and annotations without building the library itself. For a quantitative team, the value is a clean historical file arriving in an existing research environment. For an originator, it is seeing a grower's relationship, offer and contract without reconciling three screens and a notebook.
The $129 doorway and the custom-priced basement
Barchart's revenue model is a ladder. The retail site offers free tools and collects advertising and sponsorship revenue through Barchart Impact. Individual users can pay for deeper features. Public signup pages list cmdtyView Lite and cmdtyView for Excel at $129 a month, cmdtyView Pro at $219 and Labs at $499, before applicable real-time exchange fees. A Barchart support page lists OnDemand APIs as starting at $500 a month. Institutional feeds, historical datasets, digital builds and workflow deployments are negotiated.
The revenue ladder / public prices checked September 2026
The cost is not just the bill. Real-time data can carry exchange charges and professional-user rules. An implementation may involve permissions, internal schemas and downstream systems. That friction is also the opportunity: a client that has mapped Barchart data into a risk engine or connected grower contracts to an ERP is buying continuity, not merely rows in a table.
The retail audience changes the economics, too. A pure infrastructure vendor has to explain its data in sales calls. Barchart can demonstrate the same raw material on a busy public site every trading day. Product teams see the charts working at scale; advertisers see an audience already sorted by intent; data partners gain another distribution outlet. The arrangement is not a classic two-sided marketplace, but it behaves like a flywheel: usage exposes gaps, new datasets improve the products, and stronger products create more distribution.
The first plan did not collapse. Its boundary did.
There is no tidy public tale of a catastrophic launch or a boardroom reversal. The early subscription site worked well enough to attract an audience. What failed first was the narrow assumption that Barchart should be only a destination. Customer requests made the boundary look artificial. If the data was useful on Barchart.com, it could be more useful inside somebody else's product.
That distinction matters for anyone tempted to copy the playbook. Barchart did not begin by announcing a platform. It began with a specific utility, watched for repeated adjacent demand, and productized what customers were already asking it to do. The audience became a live product lab. The internal capability became an external service. The service moved closer to workflow.
Recent launches repeat the pattern. Market Replay Enterprise delivers normalized historical exchange data through AWS or secure file transfer, promising to turn months of internal pipeline work into days. A partnership with Kalshi pushes prediction-market data across both Barchart.com and institutional products. A direct London Metal Exchange connection adds depth in metals. Planet satellite imagery improves daily crop-yield models. Grão Direto contributes transaction-informed Brazilian grain prices.
In April 2026, Barchart added Carl, an AI assistant, to cmdtyView. The sensible part is not the chatbot. It is the location. Carl sits inside a specialist environment with pricing, fundamentals, news, physical markets and research. The wager is that conversation saves time only when the underlying data is licensed, structured and relevant to the work at hand.
The part worth copying - and the conditions attached
Build a useful public surface. Notice which capabilities business users repeatedly request. Turn those capabilities into modular products, then follow the customer into the workflow where a decision is made.
It is a poor fit when the free product does not earn repeat attention, the underlying asset cannot be licensed, reliability is not a core competence, or the company lacks patience for exchange rules and long enterprise sales. Without those conditions, the “audience plus infrastructure” model is simply two expensive businesses sharing a logo.
Where Barchart sits when Bloomberg is too much and a chart is too little
Barchart competes in slices, not one neat category. Bloomberg, LSEG, FactSet and ICE dominate institutional data and terminals. TradingView and Koyfin are strong visual analysis products. Specialist APIs sell developers focused datasets. DTN, StoneX, Fastmarkets and S&P Global Commodity Insights meet commodity and agricultural buyers from different angles.
Barchart's position is between those lanes: broader than a widget vendor, more modular than a terminal, more operational than a finance website and unusually comfortable with physical agriculture. A Canadian publisher such as BayStreet.ca can deploy its interactive charts within days. A fintech can pipe quotes into an application. A food company can monitor commodity exposure. A grain elevator can manage a producer offer and the corresponding hedge.
That range creates its own risk. Retail media, exchange infrastructure and agricultural software demand different muscles. Barchart's answer is that they all begin with the same raw material. After three decades, the company still puts numbers on screens. It has simply become much more interested in what happens after someone reads them.