At Carhartt, the trouble had a wonderfully unglamorous address: materials planning and inventory control. The workwear maker’s MSO application helped keep manufacturing and distribution moving. When it slowed, the people responsible could struggle to tell whether the application or its infrastructure was at fault. Before anyone could fix the problem, someone had to establish where it lived.
That predicament explains AppDynamics better than a catalog of monitoring features. A business process crosses boundaries that an organization chart carefully separates. Customers experience the whole trip. Engineers often see their own stretch of road. AppDynamics tries to give them a map of the journey.
- Follow the transaction: trace actions such as checkout through their technical dependencies.
- Choose what matters: connect performance trouble to business consequences.
- Know the new address: AppDynamics now sits inside Cisco’s Splunk Observability portfolio.
The customer does not care which server it was
Consider an illustrative online purchase. A browser calls a checkout service, which calls inventory, which consults a database. Each component can be running while the purchase remains painfully slow. Knowing that the machines are alive does little for the person waiting to pay.
AppDynamics organizes this activity into a “business transaction.” Agents discover transactions, follow requests across application tiers and put the connections on a topology map. An engineer can inspect a slow transaction and work toward the service, dependency or code responsible. The unit of investigation becomes something the business recognizes: a login, a cart addition, an order.
This is application performance monitoring, or APM, with a business-facing vocabulary. AppDynamics also offers database monitoring, browser and mobile experience monitoring, synthetic tests, runtime application security and SAP diagnostics. Its particular emphasis is connecting technical performance to the work an enterprise needs to finish.
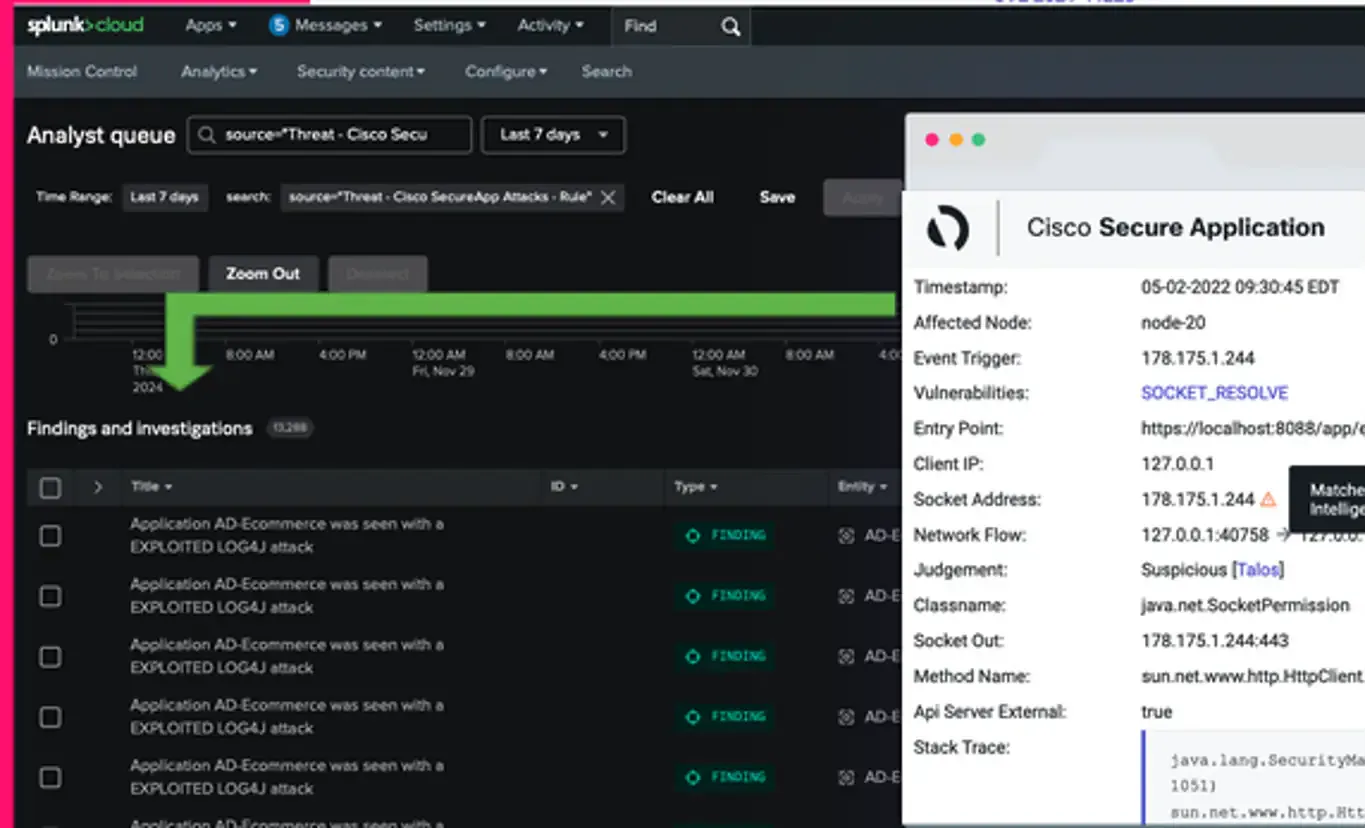
That expertise extends into the handoff between application and security teams. The 2025 release added a way to forward application attack alerts into Splunk for investigation. Mobile session replay, introduced then as a public preview, offered another kind of evidence: the sequence of actions preceding an error. Both address a familiar frustration. Reproducing a customer’s problem can take longer than recognizing that something went wrong.
Overalls, orders and the missing message
Carhartt adopted AppDynamics as it modernized its technology. The deployment covered critical applications, SAP HANA, customer websites and the middleware connecting inventory, warehouses and distribution. Business iQ helped the team inspect customer journeys and find channel messages that were failing to reach SAP.
The interesting change was operational: a slowdown could be investigated across application and infrastructure boundaries, then directed to the relevant operator or vendor. In Splunk’s published account, Carhartt reports avoiding service interruptions and substantial operating costs. Those are customer claims, rather than a controlled estimate of what every buyer should expect.

Vodafone Italia supplies another version of the problem. Starting in 2018, it centralized monitoring for more than 30 business applications across a multi-cloud environment. The published case describes billions of transactions analyzed and scan times shortened from days to hours. Employee training helped adoption grow, too. Shared data needed people who knew how to use it.
“AppDynamics is our Rosetta Stone”Enrico Croce, Vodafone Italia, in Splunk’s customer account
The company that almost rang the bell
Jyoti Bansal founded AppDynamics in 2008. Bhaskar Sunkara became its founding CTO. By October 2016, the company counted approximately 1,975 customers in more than 50 countries, including over 275 of the Global 2000. Its intended audience was already clear: enterprises with consequential, complicated software.
There was serious money behind that ambition. A December 2015 financing brought in $158 million, led by General Atlantic and Altimeter Capital. AppDynamics prepared to go public. Then Cisco agreed to acquire it in January 2017, just before the planned offering was due to price. Cisco announced completion in March, at approximately $3.7 billion in cash and assumed equity awards.
The decision changed the destination from the stock market to a larger technology company. It also matched Cisco’s stated desire to see across applications and networks. The deal price tells us what Cisco agreed to pay; it cannot, by itself, tell us how well a monitoring deployment will work.
Read the small unit beside the price
AppDynamics sells enterprise software subscriptions, with hosted and self-managed deployment choices. Its licensing documentation describes infrastructure-based packages measured in CPU cores. Applications, analytics, end-user monitoring and security can involve different entitlements and add-ons. The buying conversation is therefore about coverage as much as a headline price.
Splunk’s observability pricing page lists AppDynamics Infrastructure, Premium and Enterprise starting at $6, $33 and $50 per vCPU per month, billed annually. A separate pricing page uses different host labels. Buyers should confirm the metering unit in their quote before multiplying anything. Infrastructure-only monitoring also buys a different scope from application tracing.
= $3,960 annually, before add-ons and implementation. Arithmetic example, not a customer quote.
Datadog, Dynatrace, New Relic and Elastic offer alternatives in this market. AppDynamics’ appeal is especially legible in traditional and hybrid enterprise applications, where business transactions and deep diagnostics matter. The useful comparison is how well each product explains your actual system, and what maintaining that explanation costs.
A new home for the same question
Cisco acquired Splunk in 2024. AppDynamics adopted Splunk branding in 2025; integrations connected application investigations with Splunk logs and security workflows. In June 2026, Splunk announced AppDynamics SaaS capabilities within its unified Observability Cloud, while reaffirming investment in AppDynamics for self-managed, air-gapped and regulated environments.
For an operator, the practical lesson begins before procurement. Choose the business operations that matter, refine transaction detection and verify the resulting coverage. AppDynamics’ own documentation stresses those choices and transaction registration limits. Instrumentation and compatible agents matter; a map cannot explain a dependency it cannot see. Start with one important journey, give someone responsibility for it, and test whether the tool can explain its delays. The checkout is a sensible place to begin.