Claymark had a thoroughly modern predicament: monitoring tools, important servers, and very little idea why its Citrix applications kept getting into trouble. The New Zealand manufacturer could see its servers. Applications and virtualization were another matter. When XenApp servers intermittently locked up, the minutes before the incident remained obscure. Owning a thermometer is small comfort when the fever has already passed.
- The job: connect slow applications to the systems they depend on.
- The sweet spot: complicated enterprises, virtual desktops and hybrid IT.
- The proposition: a shared diagnosis instead of separate teams interpreting separate tools.
- The buying test: make it explain an incident you already understand.
That is the opening eG Innovations occupies. Its flagship, eG Enterprise, brings application, infrastructure and digital workspace monitoring into one console. The company sells to the people who must explain why somebody cannot work, even when several computers insist that everything is perfectly satisfactory.
Claymark’s finance chief, Trevor Jacobs, described the contradiction neatly: “We had a number of tools, yet still had limited visibility.” After deploying eG Enterprise, the team investigated critical and major alerts immediately. Its published case study says the Citrix lockups disappeared within weeks. The change involved both better visibility and a routine for acting on it. Software supplied the evidence; people still had to follow it.
01 / A healthy machine can be a dreadful colleague
An application is a chain of obligations. A user signs in. An identity service answers. A virtual desktop launches. The application asks a database for something. Storage supplies it. The network carries it back. Any one participant can be responsive by its own definition while the whole arrangement feels intolerably slow.
eG’s approach is to discover components, map their dependencies and correlate what happens across them. It uses models of the technologies being monitored, machine-learning baselines and a root-cause diagnosis engine to help distinguish an originating problem from its downstream symptoms. The useful question becomes: which dependency could explain the experience we are seeing?
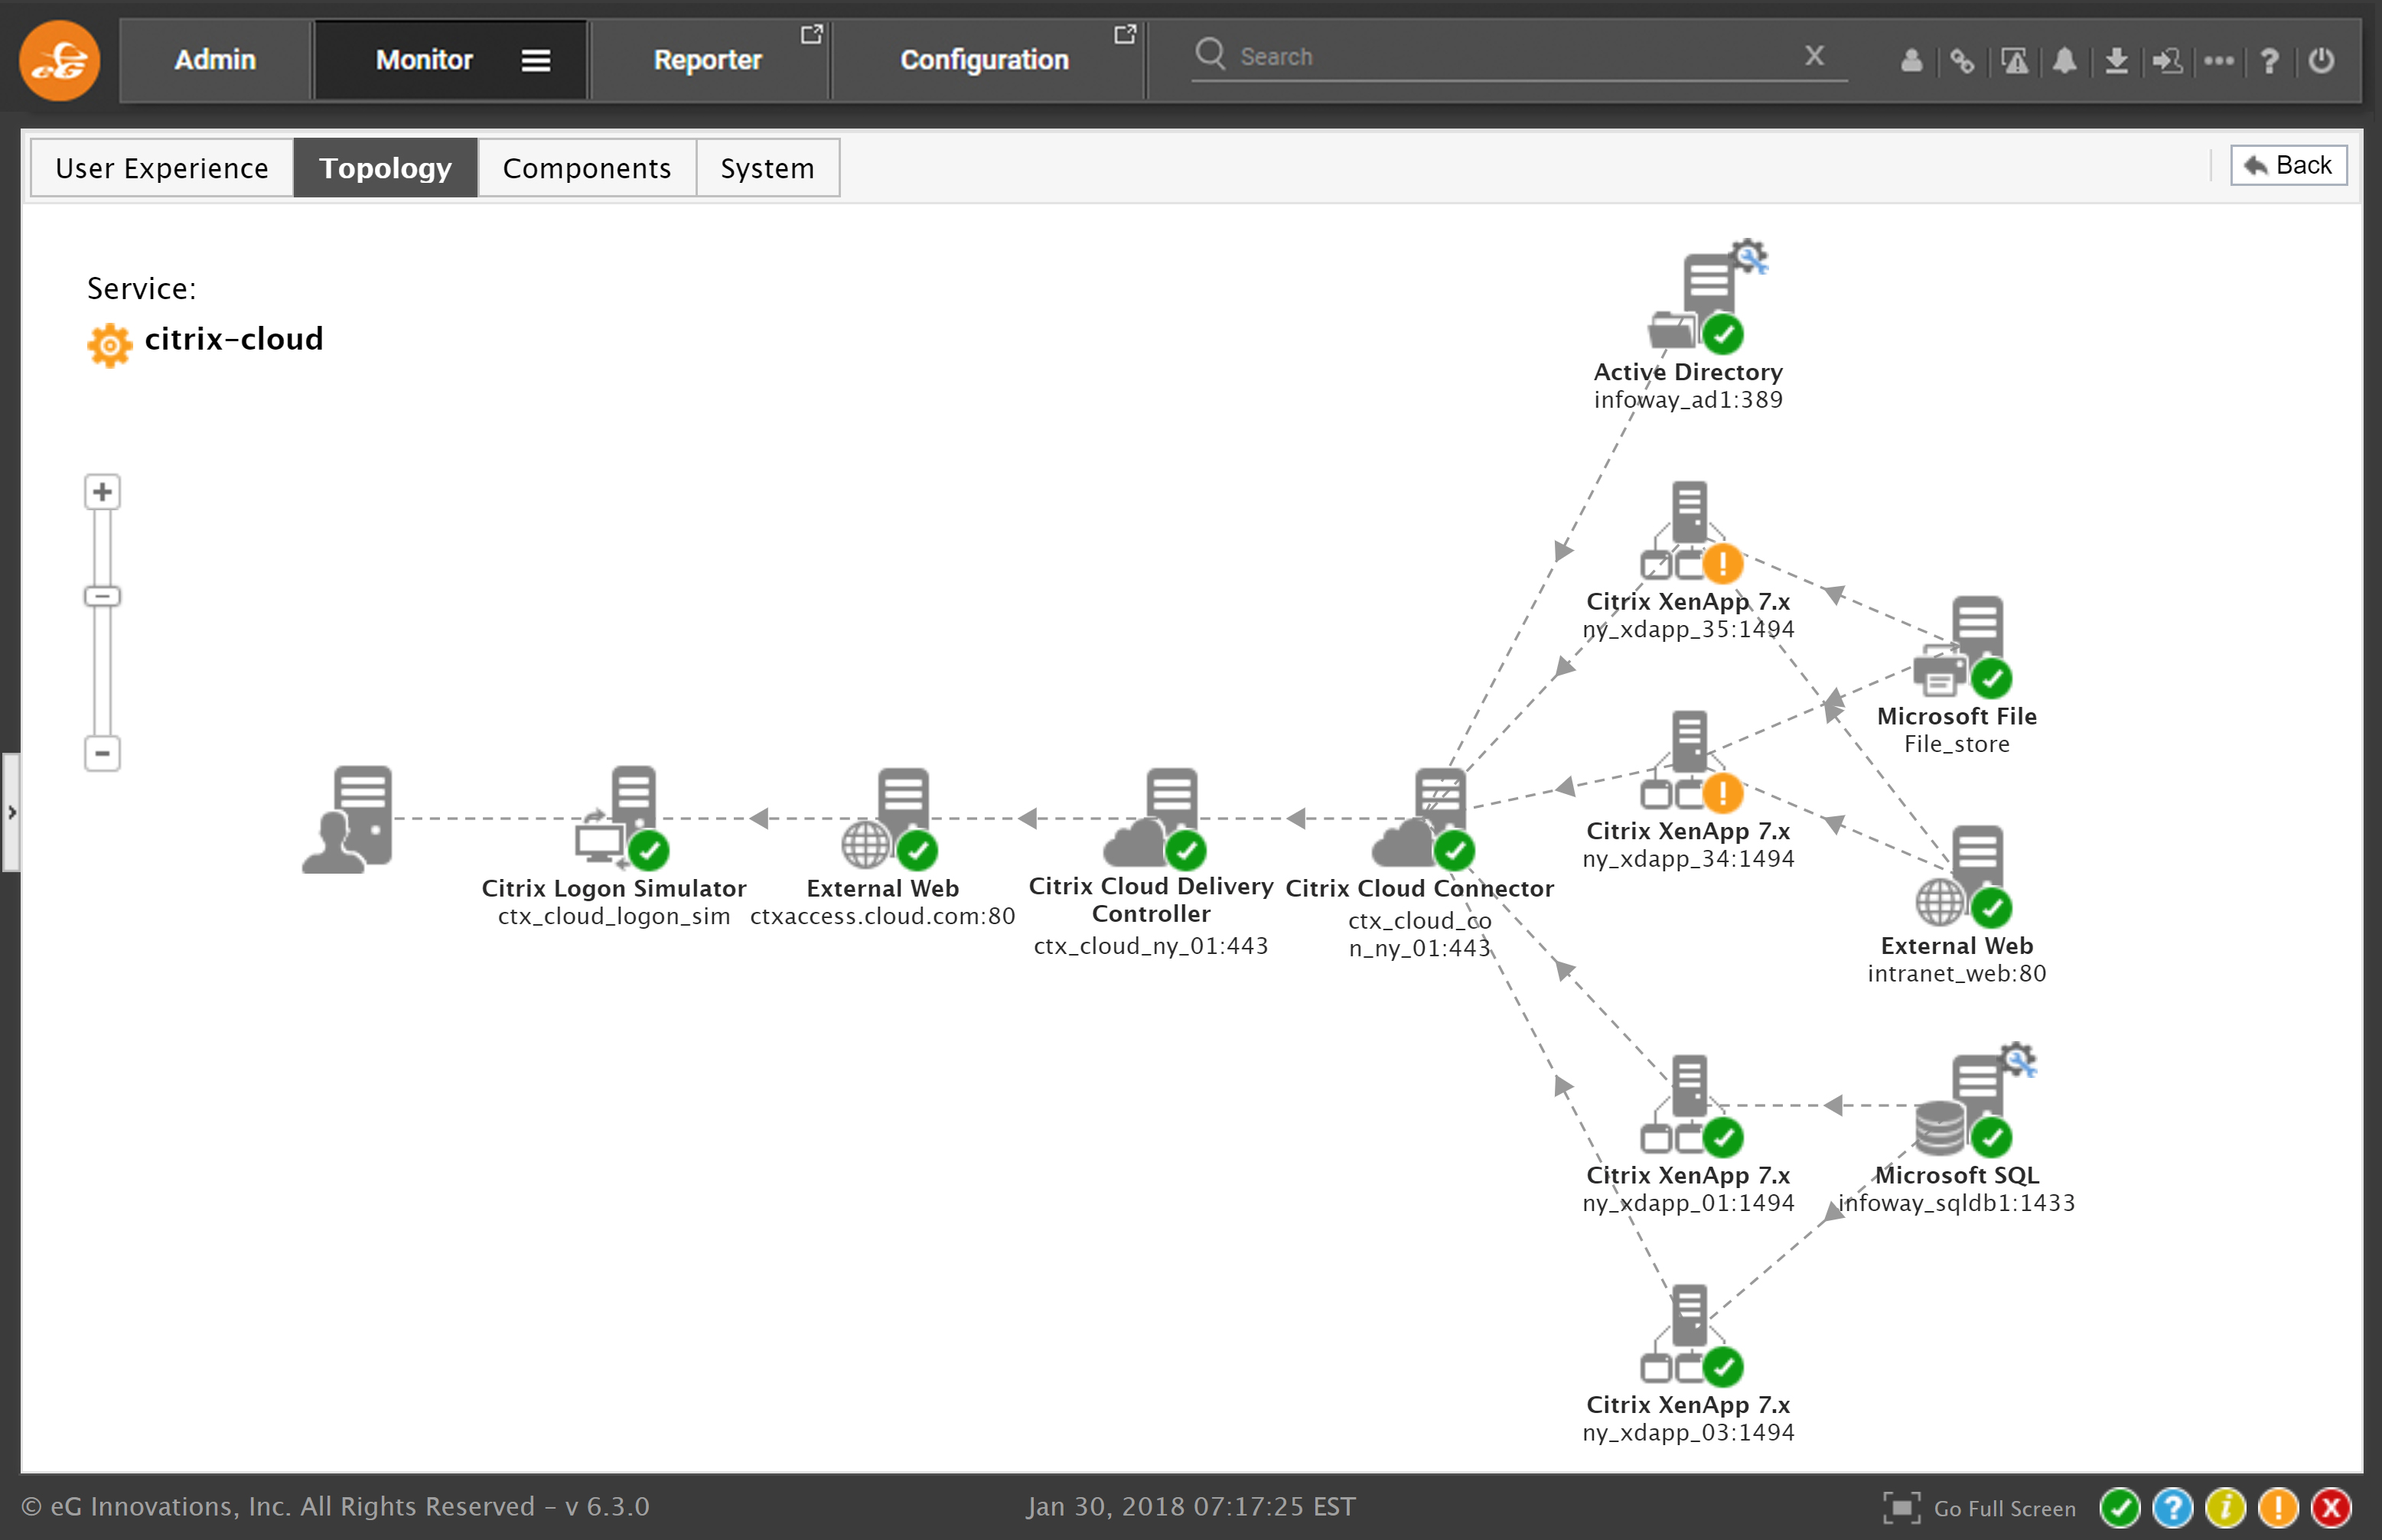
Virtualization makes this especially interesting. A virtual machine has an inside, with its operating system and applications, and an outside, where a hypervisor shares physical resources among machines. Watching both helps an administrator investigate whether a guest’s trouble comes from its own workload or from the environment hosting it. A desktop can be accused of laziness when it is really waiting for somebody else.
Dependency correlation connects the symptom to the systems that could explain it.
02 / The scientist behind the support call
There is a reason the company sounds preoccupied with diagnosis. Before starting eG Innovations, Srinivas Ramanathan was a senior research scientist at Hewlett-Packard Laboratories in Palo Alto. He was chief architect of Firehunter, an internet service provider performance-monitoring product, and contributed to HP’s WebQoS work. His background includes a computer science and engineering doctorate from the University of California, San Diego.
Founded in 2001, eG has followed the systems that enterprise customers actually use. Its company history records service topology in 2005, deeper virtualization monitoring in 2008 and cloud monitoring in 2014. Later additions brought transaction tracing, container support and more digital workspace capabilities. The continuity is the diagnostic problem; the places where it hides keep multiplying.
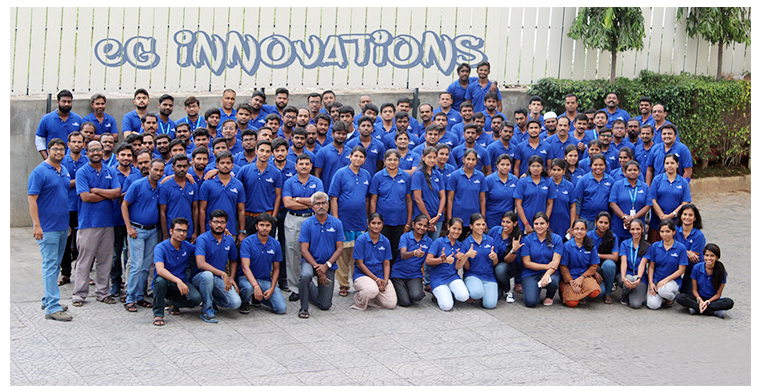
An employee’s 2021 career account offers a less technical view: founder mentoring, office trips, quarterly lunches and Pongal celebrations. It is one employee’s recollection, but it supplies a pleasing detail. A business concerned with remote systems also has a history of colleagues getting together in person.
03 / Five minutes is a different working day
The buyers are enterprise IT operations teams, architects, developers, site reliability engineers and managed service providers. Their organizations span healthcare, finance, education, government, manufacturing and retail. The common feature is an environment with enough moving parts that a narrow tool can leave expensive questions unanswered.
Community Care Physicians makes the value tangible. Its case study describes approximately 1,800 medical and administrative staff, and an IT team whose basic network and database tools did not provide the Citrix visibility it needed. The team reports moving diagnosis and remediation from 20 minutes to five, while synthetic checks replaced manual morning inspections.
Time spent diagnosing and remediating
Customer case-study figures. A specific deployment, rather than a forecast for every buyer.Other customers describe different returns. SkyLink Data Centers reports 25% greater server density and more than $170,000 in hardware savings. In eBay’s call-center case study, covering more than 10,000 users, the benefit included identifying where latency originated and reducing partner chargebacks. Sometimes the valuable discovery is that the fault belongs elsewhere, provided you can demonstrate it without assembling a committee.
These accounts matter because they put monitoring into ordinary budgets: support time, infrastructure purchases and service obligations. They also suggest a useful discipline. Specify the result you need before selecting the graph you would like to admire.
04 / A rehearsal that leaves the browser
The platform’s tools address different parts of that investigation. Application performance monitoring follows transactions and code execution. Real user monitoring observes actual web experiences. Digital workspace monitoring examines logons, sessions and responsiveness. Infrastructure monitoring supplies the context beneath those symptoms.
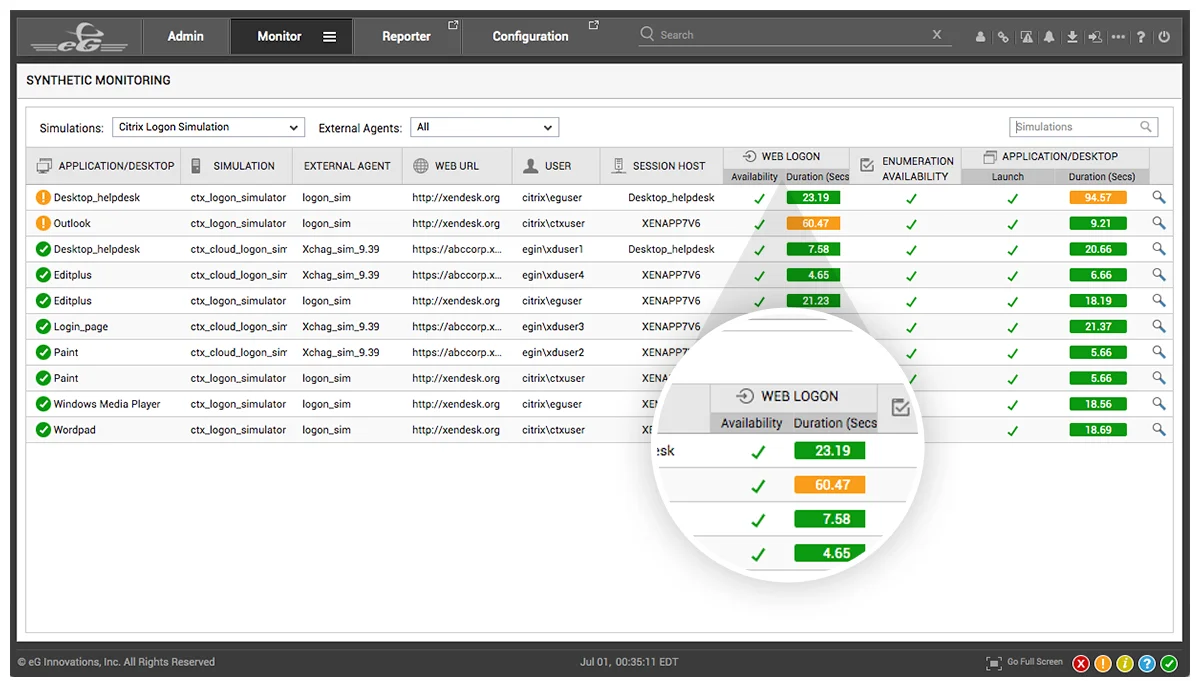
Synthetic monitoring does something complementary: it sends a software user through a planned journey before an actual user has to discover the failure. eG announced its Universal Synthetic Monitoring capability in November 2025. It combines browser automation with optical character recognition to cover workflows across web, thin-client and thick-client applications, with support for authentication scenarios including multi-factor sign-in.
“Synthetic monitoring has to evolve beyond script maintenance and browser-only visibility.”
Srinivas Ramanathan / November 2025
An unnamed healthcare and medical-technology customer illustrates the buying trigger. According to eG’s case study, a discontinued thick-client simulation capability left part of its estate uncovered. The organization selected eG after an end-to-end simulation ran within hours during a proof of concept. Its subsequent rollout covered 12 locations. The customer estimates more than 80% lower total ownership cost than its previous approach, including maintenance and resource use. That estimate belongs to that implementation.
05 / The invoice has its own dependencies
eG sells business software through direct sales and partners. Buyers can choose SaaS or operate the management platform themselves. Its published entry prices are $125 a month for SaaS, $100 a month for subscription and $10,000 for a minimum perpetual configuration. Those are starting points, not a price for an entire enterprise.
APM and unified monitoring licenses depend on the operating systems, storage devices and hypervisors being monitored. Digital workspace licensing can instead follow named or concurrent users. Scope optional capabilities and services explicitly. A useful purchasing conversation covers what needs an agent, what can be monitored remotely, retention, synthetic tests and who will maintain the deployment.
For a small evaluation, eG Enterprise Lite advertises a free tier for three applications or 50 concurrent users. For partner MSPs, eG promotes consumable, pay-per-use licensing. Both fit a company whose product can begin with a troublesome service and grow into a wider monitoring estate.
06 / Take your most awkward incident to the demo
The market is crowded. APM and observability alternatives include Dynatrace, Datadog, AppDynamics and New Relic; infrastructure specialists and native platform tools offer other routes. eG’s pitch brings application diagnosis together with infrastructure context and substantial digital workspace coverage. Whether that combination is useful depends on the buyer’s actual estate.
There are concrete integration credentials behind the pitch: AWS Digital Workplace Competency, announced in 2023; certified integration with RISE for SAP S/4HANA Cloud, announced in 2024; and availability on the IGEL App Portal. In July 2026, eG announced a Silver Globee award for APM and observability. Credentials help establish compatibility and recognition. Your incident history supplies the harder examination.
Bring one known slowdown into a trial. Ask the tool to capture the affected user journey, show its dependencies and identify the first diagnostic clue. Check whether the people on first-line support can use that evidence. Time the investigation. Count the steps and the handoffs. Repeat after a change to the application.
This approach is less compelling for a simple service already explained by its existing tools. Missing telemetry, inaccessible dependencies or neglected synthetic workflows can still leave gaps. Buying a shared console will also accomplish little if teams refuse to share an investigation. Claymark’s useful detail was the routine that followed the alert. The graph earns its place when somebody can act on it.