The least useful moment in an analytics purchase is often the polished demo. The sample data behaves. The funnel is already named. A cursor glides from a falling conversion rate to the offending segment, and the answer arrives before anyone has time to ask who defined “activated.” Then the trial account meets a real company: six versions of the same checkout event, two user identifiers, and a product manager who needs an answer before Thursday.
This is the setting in which the Amplitude-versus-Mixpanel question should be answered. Both platforms ingest behavioral events and turn them into funnels, retention views, cohorts, paths, and dashboards. Both advertise self-service analysis. Both now reach beyond the category in which buyers first learned their names. Amplitude spans product and web analytics, replay, feature and web experimentation, feature management, surveys, activation, and AI assistance. Mixpanel now describes a broad digital analytics platform with web and mobile analysis, replay, warehouse connections, feature flags, experimentation, metric trees, and an AI agent.
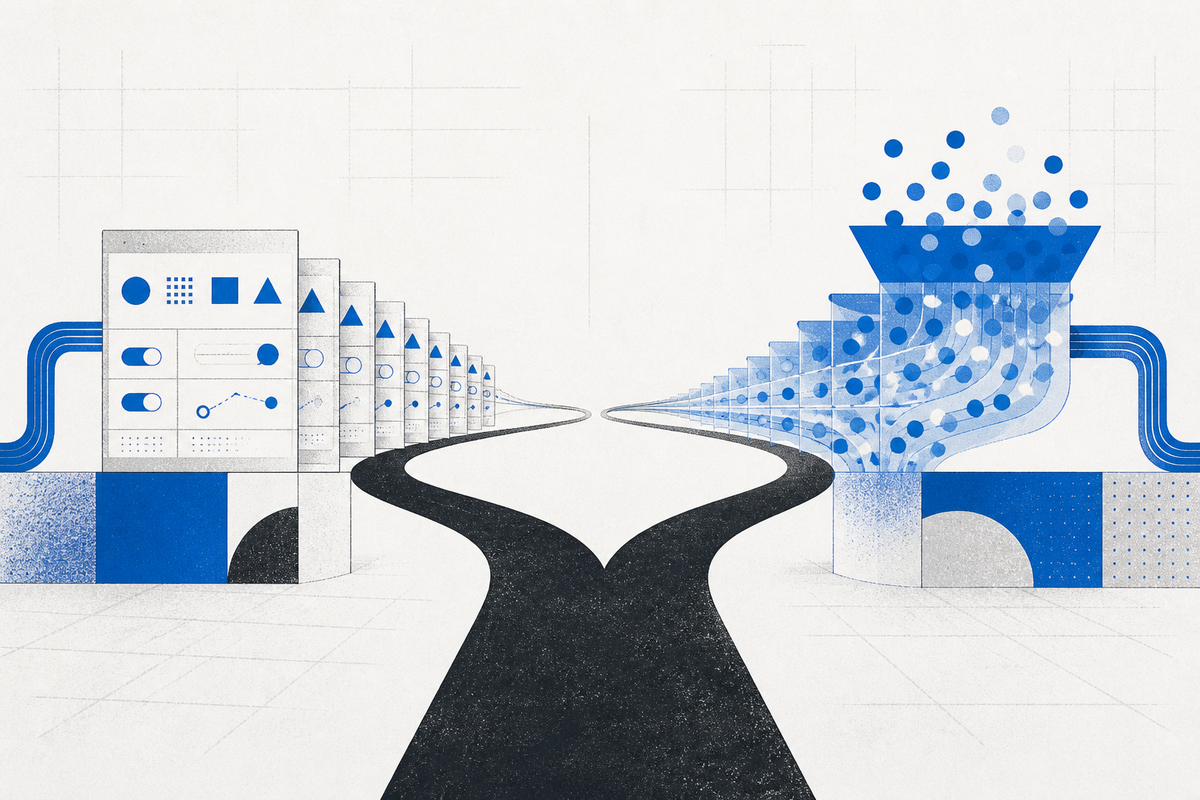
The feature grid has become a hall of mirrors. The products differ more usefully in the habits they have spent years making natural. Amplitude’s center of gravity is a governed product-learning system: define behavior, find a signal, form a hypothesis, deliver a variant, and measure it with shared metrics. Mixpanel’s enduring appeal is the speed with which a curious operator can assemble a funnel, split it by a property, save a cohort, and chase the next question. The distinction is historical and directional, not absolute. It tells you where to begin a trial, not where you must finish.
The same events, a different posture
Imagine a subscription app with an onboarding leak. New users create an account, connect a data source, invite a teammate, and then disappear before publishing their first report. A growth lead wants to know where the loss occurs. A product manager wants to know which behavior predicts retention. An engineer wants to release a shorter setup flow to part of the audience. A data lead wants everyone to use the same definition of activation.
Mixpanel’s familiar entry point is the behavior itself. Its public material emphasizes event tracking, funnels, retention, flows, segmentation, and answers that do not require SQL. Its retention model supports rolling and calendar intervals, a distinction with practical consequences: product stickiness often makes sense in elapsed time, while a campaign team may care about the next calendar week. That vocabulary fits a team whose main bottleneck is the distance between a hunch and a segmented answer.
Amplitude can perform those analyses too. Its documentation lists event segmentation, funnel and retention analysis, journeys, behavioral cohorts, engagement matrices, and experiment results among its chart types. But the product’s broader narrative repeatedly closes the loop. A behavior correlated with conversion can become a cohort; a hypothesis can become a flag or A/B test; the result can be read against the same metric definitions. Its own conversion-driver guide gives the important warning that correlation is not causation, then points teams toward experimentation.
The product-learning loop
A platform is not merely where the answer lives. It is where the next question becomes cheap.YesPress analysis
What the old labels still get right
It is tempting to say Amplitude is for product and Mixpanel is for growth. That sentence is tidy and increasingly wrong. Amplitude has marketing analytics and web experimentation. Mixpanel explicitly serves product and engineering alongside growth, and it has been expanding the governed, enterprise end of its system. In 2025, Mixpanel’s own analytics team wrote about moving internal business dashboards from Looker as warehouse connectors, historical profile properties, shared metrics, and permission controls matured.
Still, a product’s history leaves grooves. Amplitude launched its integrated Experiment product in 2021 and has continued to stress the connection among behavioral cohorts, feature delivery, statistical analysis, and shared data. Teams already running a formal experimentation program may find that architecture familiar. The person asking the question is often a product manager working alongside engineering and data science, and the expected output is not only a chart but a controlled decision.
Mixpanel’s self-serve promise has long spoken to the operator with a live funnel problem. Its scale-up page is unusually direct about small data teams, no-SQL exploration, product-market fit, marketing impact, and allocating spend. That does not make it a lightweight product. It makes legibility part of the pitch. The expected action may be a new campaign segment, a repaired onboarding step, or a sharper question for the product team.
Amplitude tends to fit when
- Experiment design and analysis are recurring product rituals.
- Shared cohorts and governed metrics must travel from insight into delivery.
- Feature flags, staged rollouts, and causal measurement belong in one workflow.
Mixpanel tends to fit when
- Growth, marketing, and product users need quick behavioral follow-ups.
- Funnel, retention, and segmentation questions dominate weekly work.
- A small data team needs more colleagues to explore without a ticket.
Treat those cards as a hypothesis. The current products overlap enough that either vendor can surprise a team carrying an old mental model. A buyer should test the workflow that matters, including the awkward handoffs. Can a marketer trust the same purchase event as finance? Can a product manager explain why a retention number changed? Can an engineer see which variant a user received? Can a data steward retire a duplicate event without breaking a dozen boards?
Your taxonomy is the real product
Every behavioral analytics demo depends on an invisible asset: a coherent language for what users do. The event called Report Published needs an owner, a trigger, properties, an identity rule, and a reason to exist. If one client fires it when the button is clicked and another fires it when the server confirms success, the chart can be precise and false at once.
Amplitude’s data-planning guidance defines a taxonomy as the events and properties a team tracks, how they are named, and how they fit together. Mixpanel’s data model rests on the same practical foundation. This is why “no analytics engineer required” should be read carefully. A non-technical user can answer many questions without SQL after good data arrives. Someone still has to decide what the events mean, verify instrumentation, manage identity, and keep definitions from drifting.
The hidden total cost of ownership lives here. Licensing may be based on monthly tracked users, event volume, seats, or add-ons, and those terms can change. The durable costs are planning, implementation, quality checks, governance, enablement, and the social work of getting teams to use the system. A cheaper quote can become expensive if every answer needs a data-team intervention. A broader suite can become waste if experimentation is purchased but never becomes a habit.
| Workflow | Evidence to collect | Failure signal |
|---|---|---|
| Explore | A non-analyst segments one real funnel and explains the count. | The first follow-up question requires a ticket. |
| Govern | An owner finds, documents, and deprecates a duplicate event. | Old charts silently keep the wrong definition. |
| Experiment | A team moves from cohort to variant to result using agreed metrics. | Flags, exposure data, and analysis require manual stitching. |
| Operate | Finance can model usage growth and paid add-ons from a real month. | The apparent price excludes the workflow you tested. |
Run a trial that can disappoint you
A fair bake-off does not ask each vendor to perform its favorite trick. It gives both the same imperfect slice of reality. Choose one journey with business weight, such as signup to first value. Include a known tracking flaw. Invite the eventual users, not only procurement and the data lead. Then watch what happens when the planned question gives way to an unplanned one.
- Load representative data. Use real identity patterns, event properties, and enough history to expose retention quirks.
- Rebuild a disputed metric. If two teams define activation differently, force the tool and the humans to make the disagreement visible.
- Trace a journey. Build the same funnel, change its order and window, create a cohort, and inspect the people who dropped.
- Hand over the keyboard. Ask a growth or product colleague who missed the sales demo to answer a follow-up without coaching.
- Price the operating model. Project volume, seats, replay, governance, data connections, experimentation, support, and internal maintenance.
The winning trial is the one that reveals friction early. Perhaps Mixpanel’s direct query experience gets a growth team to useful questions faster. Perhaps Amplitude’s shared cohorts and experiment workflow eliminate handoffs that have been slowing releases. Perhaps an existing warehouse, flagging system, or privacy requirement determines the answer before interface preference matters. A mature choice can be boring. Boring is underrated when the software must survive reorganizations, naming debates, and a quarter in which nobody has time to rebuild the tracking plan.
There is also a legitimate answer that product comparisons tend to hide: wait. If the team cannot name its critical events, does not know who owns instrumentation, and has no recurring meeting where behavioral evidence changes a decision, a new platform may produce a nicer museum of charts. Start with one decision, one owner, and one cadence. Buy the machinery when there is a learning loop to accelerate.
Choose the system your team can maintain on an ordinary Tuesday, not the one that performs best on demo day.YesPress analysis
Frequently asked questions
What is the main difference between Amplitude and Mixpanel?
Their core analytics capabilities overlap heavily. Amplitude has a strong integrated path from governed product analysis into feature and web experimentation. Mixpanel is especially approachable for rapid funnels, cohorts, retention, and segmentation. Workflow is a better discriminator than a static feature list.
Is Amplitude only for product teams?
No. Amplitude also markets web and marketing analytics, replay, activation, surveys, feature management, experimentation, and AI assistance. Its product and experimentation history is a center of gravity, not a boundary.
Is Mixpanel only for growth and marketing?
No. Mixpanel explicitly serves product, engineering, growth, marketing, and data teams. Its current platform extends into replay, warehouse connections, governance, feature flags, experimentation, and business analysis.
Which is easier without an analytics engineer?
Both support no-SQL, self-serve analysis. Mixpanel often feels direct for ad hoc funnel work, but ease depends on a clean tracking plan. Test both with your own data and the non-technical people who will use the result.
How should a team make the final choice?
Recreate one real journey and one disputed metric in both products. Test governance, follow-up analysis, experimentation handoffs, and permissions. Then compare the full operating cost, including implementation, maintenance, training, and add-ons.