The interesting thing about Tableau is what happens after the first chart. A bar looks odd. You split it by region. One region looks odder. You add a date. A question you could not have written five minutes earlier suddenly becomes the question that matters. Tableau built its business around keeping that sequence alive.
- Drag fields, explore patterns, share interactive dashboards.
- Free tools invite individuals in; paid subscriptions support private collaboration.
- Its AI push makes shared definitions and trustworthy data even more consequential.
Business intelligence sounds like a department. Tableau’s proposition was closer to a habit: let the person who knows the business investigate the numbers. A branch manager, marketing analyst, or researcher could follow a hunch without translating every step into a request for a database specialist. The chart became a working surface.
A database you could move with your mouse
Tableau began in 2003 with Christian Chabot, Chris Stolte, and Pat Hanrahan. Its intellectual starting point was Stanford research called Polaris. The central technology, VizQL, connects a visual specification to a database query. Dragging a field can change both the picture and the question sent to the data.
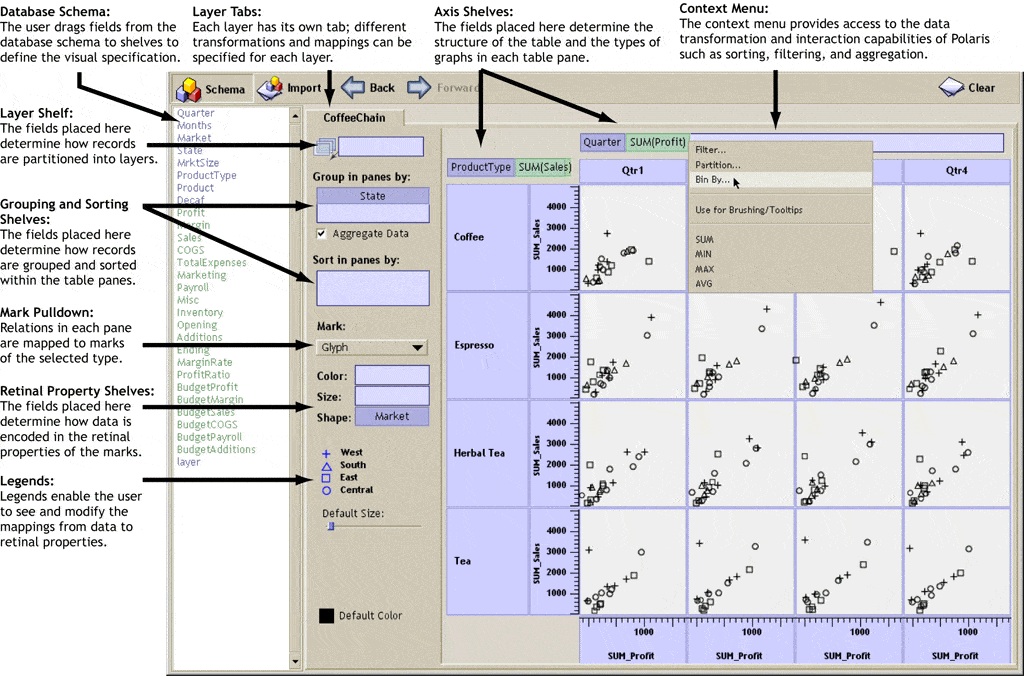
The first commercial product, Tableau Desktop, arrived in 2004. Making the research usable required unglamorous decisions. The team chose familiar Windows technology to ease installation. Database connectors needed carefully tuned queries. Immediate feedback mattered: if each adjustment interrupted thought, the product’s central advantage would evaporate.
That is a useful lesson for anyone building software. Remove a small interruption from an activity people repeat all day, and the improvement can reach beyond the seconds saved. People may attempt questions they previously abandoned. Tableau’s design made room for that possibility.

The bank needed permission to be curious
A bank offers a less romantic test than a laboratory. JPMorgan Chase had business teams hungry for answers and an obligation to control access. Tableau’s published case study describes an expansion from 400 Server users in 2011 toward 215,000 users, with more than 500 teams using the software. Those are historical, company-reported figures.
The consequential detail is organizational. IT worked with Compliance, Audit, and Risk on governance, while a center of excellence supported adoption. Marketing could examine relationships across products and customer touchpoints. Reporting work that had taken months could take weeks, saving thousands of hours, according to the case study.
Manual reporting time, with governance supporting self-service.
The lesson to copy is the pairing: give people room to investigate, and give them agreed rules for what they can access. A tool cannot settle departmental arguments about the definition of a customer. Faster exploration becomes more useful when people share those definitions.
The free gallery has a very public door
Tableau Public, launched in 2010, took the same curiosity outside the office. Journalists, students, and enthusiasts could publish interactive visualizations for anyone to explore. By November 2024, Tableau reported more than five million participants and eleven million visualizations. A hobby could now produce a portfolio.
The gallery also became a classroom. Where downloading is enabled, you can open someone else’s workbook and inspect how it works. That makes the finished chart a starting point for learning. Community projects and user groups give people somewhere to practice, compare decisions, and ask why a particular view works.
But publication has consequences. Tableau Public is for public data; a hidden profile entry does not make its visualization private. In 2011, a controversy involving WikiLeaks material prompted a revised data policy and an advisory board. Making publishing easy also meant deciding what the service would host.
What you buy when you buy the chart
The product family follows the work. Desktop supports visual analysis. Prep cleans and combines data. Cloud hosts collaboration; Server lets organizations manage their own deployment. Pulse follows metrics and supplies explanations. Next brings Salesforce-native analytics, shared business logic, and AI agents into operational workflows.
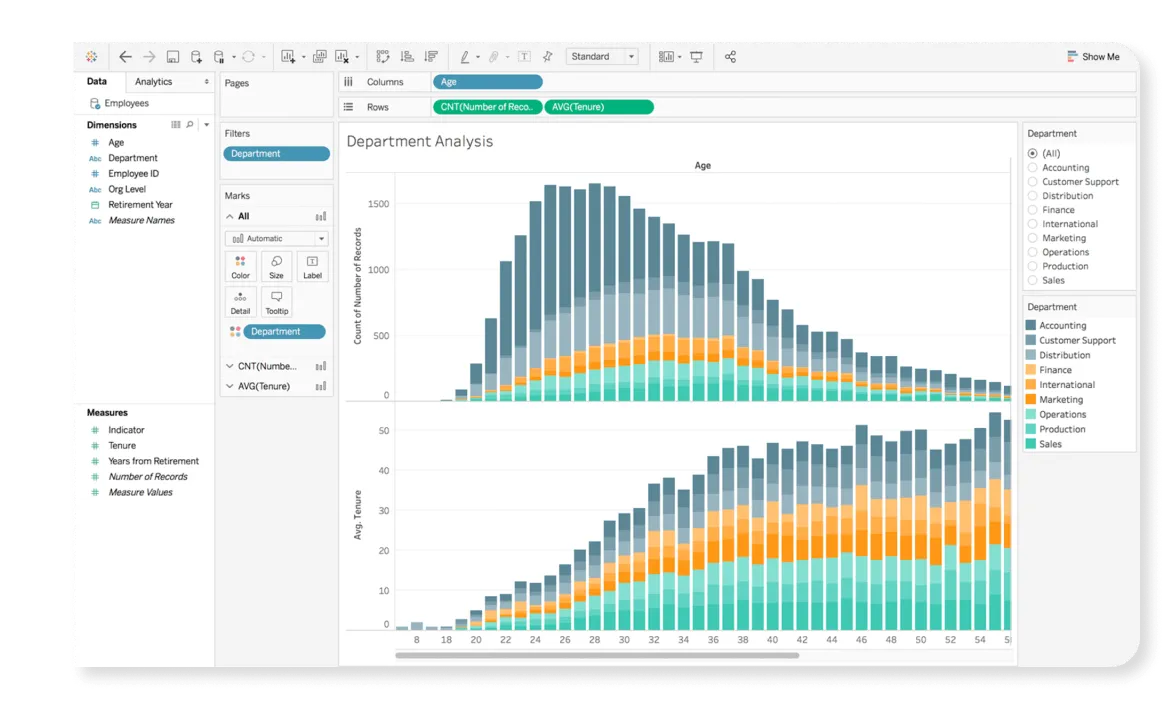
Tableau occupies the enterprise analytics market alongside Microsoft Power BI, Qlik, and Google Looker. Its distinctive starting point is visual exploration: constructing and revising a view as you think. Connections to platforms such as Snowflake and Google Cloud let that work sit above existing data infrastructure. The warehouse and the analytical interface do different jobs.
Prepare02
Explore03
Share04
Ask again
On October 22, 2026, Tableau advertises Standard from $15 per user per month, billed annually, and Next from $40. Every deployment requires a Creator license. Roles and editions change the bill; these starting prices are not complete project budgets. Preparation, administration, and training still require somebody’s time.
For an individual, Desktop Free Edition supports local analysis, while Public supports public sharing. Private organizational collaboration is where paid deployment becomes relevant. If all you need is a small, occasional spreadsheet report, maintaining a broader analytics platform may add work without enough benefit.
Now the software asks back
Salesforce’s 2019 acquisition agreement assigned Tableau an announced enterprise value of $15.7 billion, net of cash. The deal closed that August. Tableau had reported $1.16 billion in 2018 revenue under ASC 606. The experimental interface had become a substantial software business.
The current direction is conversational. Next arrived in 2025. Tableau’s 2026.3 release lists Knowledge as generally available in Cloud+ and Tableau+, while Agent in Dashboards remains beta and Next’s Proactive Intelligence is coming soon. Availability matters: an announcement is not a deployed capability.
“Help people see and understand data.”Tableau’s mission
The old design problem remains. A drag, a chart, or a sentence must lead to an answer a person can inspect. Shared meaning, permissions, and clean data become more consequential when an agent does some of the asking. Tableau’s next test is whether the conversation stays useful when fewer of its steps are visible.