A shopper sees an OLLY advertisement on Amazon, then buys the vitamins at Target. The advertisement has done something useful. An Amazon-only sales report, however, cannot tell the whole story. Somewhere between the impression and the checkout, the customer has wandered out of the frame.
- Stackline connects competitive retail data with a brand’s own commerce performance.
- Its tools cover research, forecasting, advertising, content, and shopper engagement.
- The practical idea: diagnose the problem, change something, measure again.
This is the gap Stackline sells into. Its Multi-Retailer Attribution combines Amazon Marketing Cloud exposure data with purchase information from opted-in shoppers. In its published OLLY case study, 48% of attributed sales occurred outside Amazon. Target and Walmart accounted for most of those off-platform sales. The campaign had a longer reach than its original scoreboard could show.
The checkout is a misleading finish line
The distinction matters because a retailer and a brand have different maps. Amazon can assess commerce inside Amazon. A vitamin company wants to know what happened to its vitamins wherever somebody bought them. Measuring the first and budgeting for the second invites mistakes.
OLLY’s measurement used a 14-day last-touch window: a qualifying exposure followed by a connected purchase received credit under that rule. The company’s account says the findings helped shift planning toward an approach spanning multiple retailers, including support for upper-funnel advertising.
“The data supports over and over again”
Summer Jubelirer, OLLY
In Stackline’s customer case study
There is a useful boundary here. Assigning credit to a purchase does not establish that the advertisement caused it. A shopper might have bought anyway. Attribution makes the ledger more complete; testing incremental demand remains a separate job. The result is interesting enough without pretending it answers every question.
First, do the work by hand
Stackline’s beginnings were considerably smaller than the datasets it now sells. Michael Lagoni and co-founders Mitch Keidan, Michael Masaki, and Raj Ramasamy wanted to build retail software. The engineering would take time. Customers could pay for help immediately.
So the early business provided consulting services and put the proceeds into product development. Stackline dates its founding to 2014, its Atlas launch to 2016, and Beacon to 2017. That sequence is the instructive part: paid work exposed recurring problems while financing an attempt to automate them.

In 2018, Lagoni told GeekWire that the business had no need to raise outside capital. By November 2020, Goldman Sachs Growth Equity had invested $50 million. TA Associates followed with $130 million in June 2021. The stated purpose of the later investment was product expansion and a wider international footprint. Customer-funded development had given way to institutionally financed growth.
A chart with somewhere to go
Atlas looks outward. It lets a brand examine competitor sales, market share, search traffic, advertising, prices, and reviews. Its segmentation tools can group products by attributes such as ingredients or size. A supplement brand can investigate the market it actually competes in, rather than accept a category so broad it conceals the interesting movement.
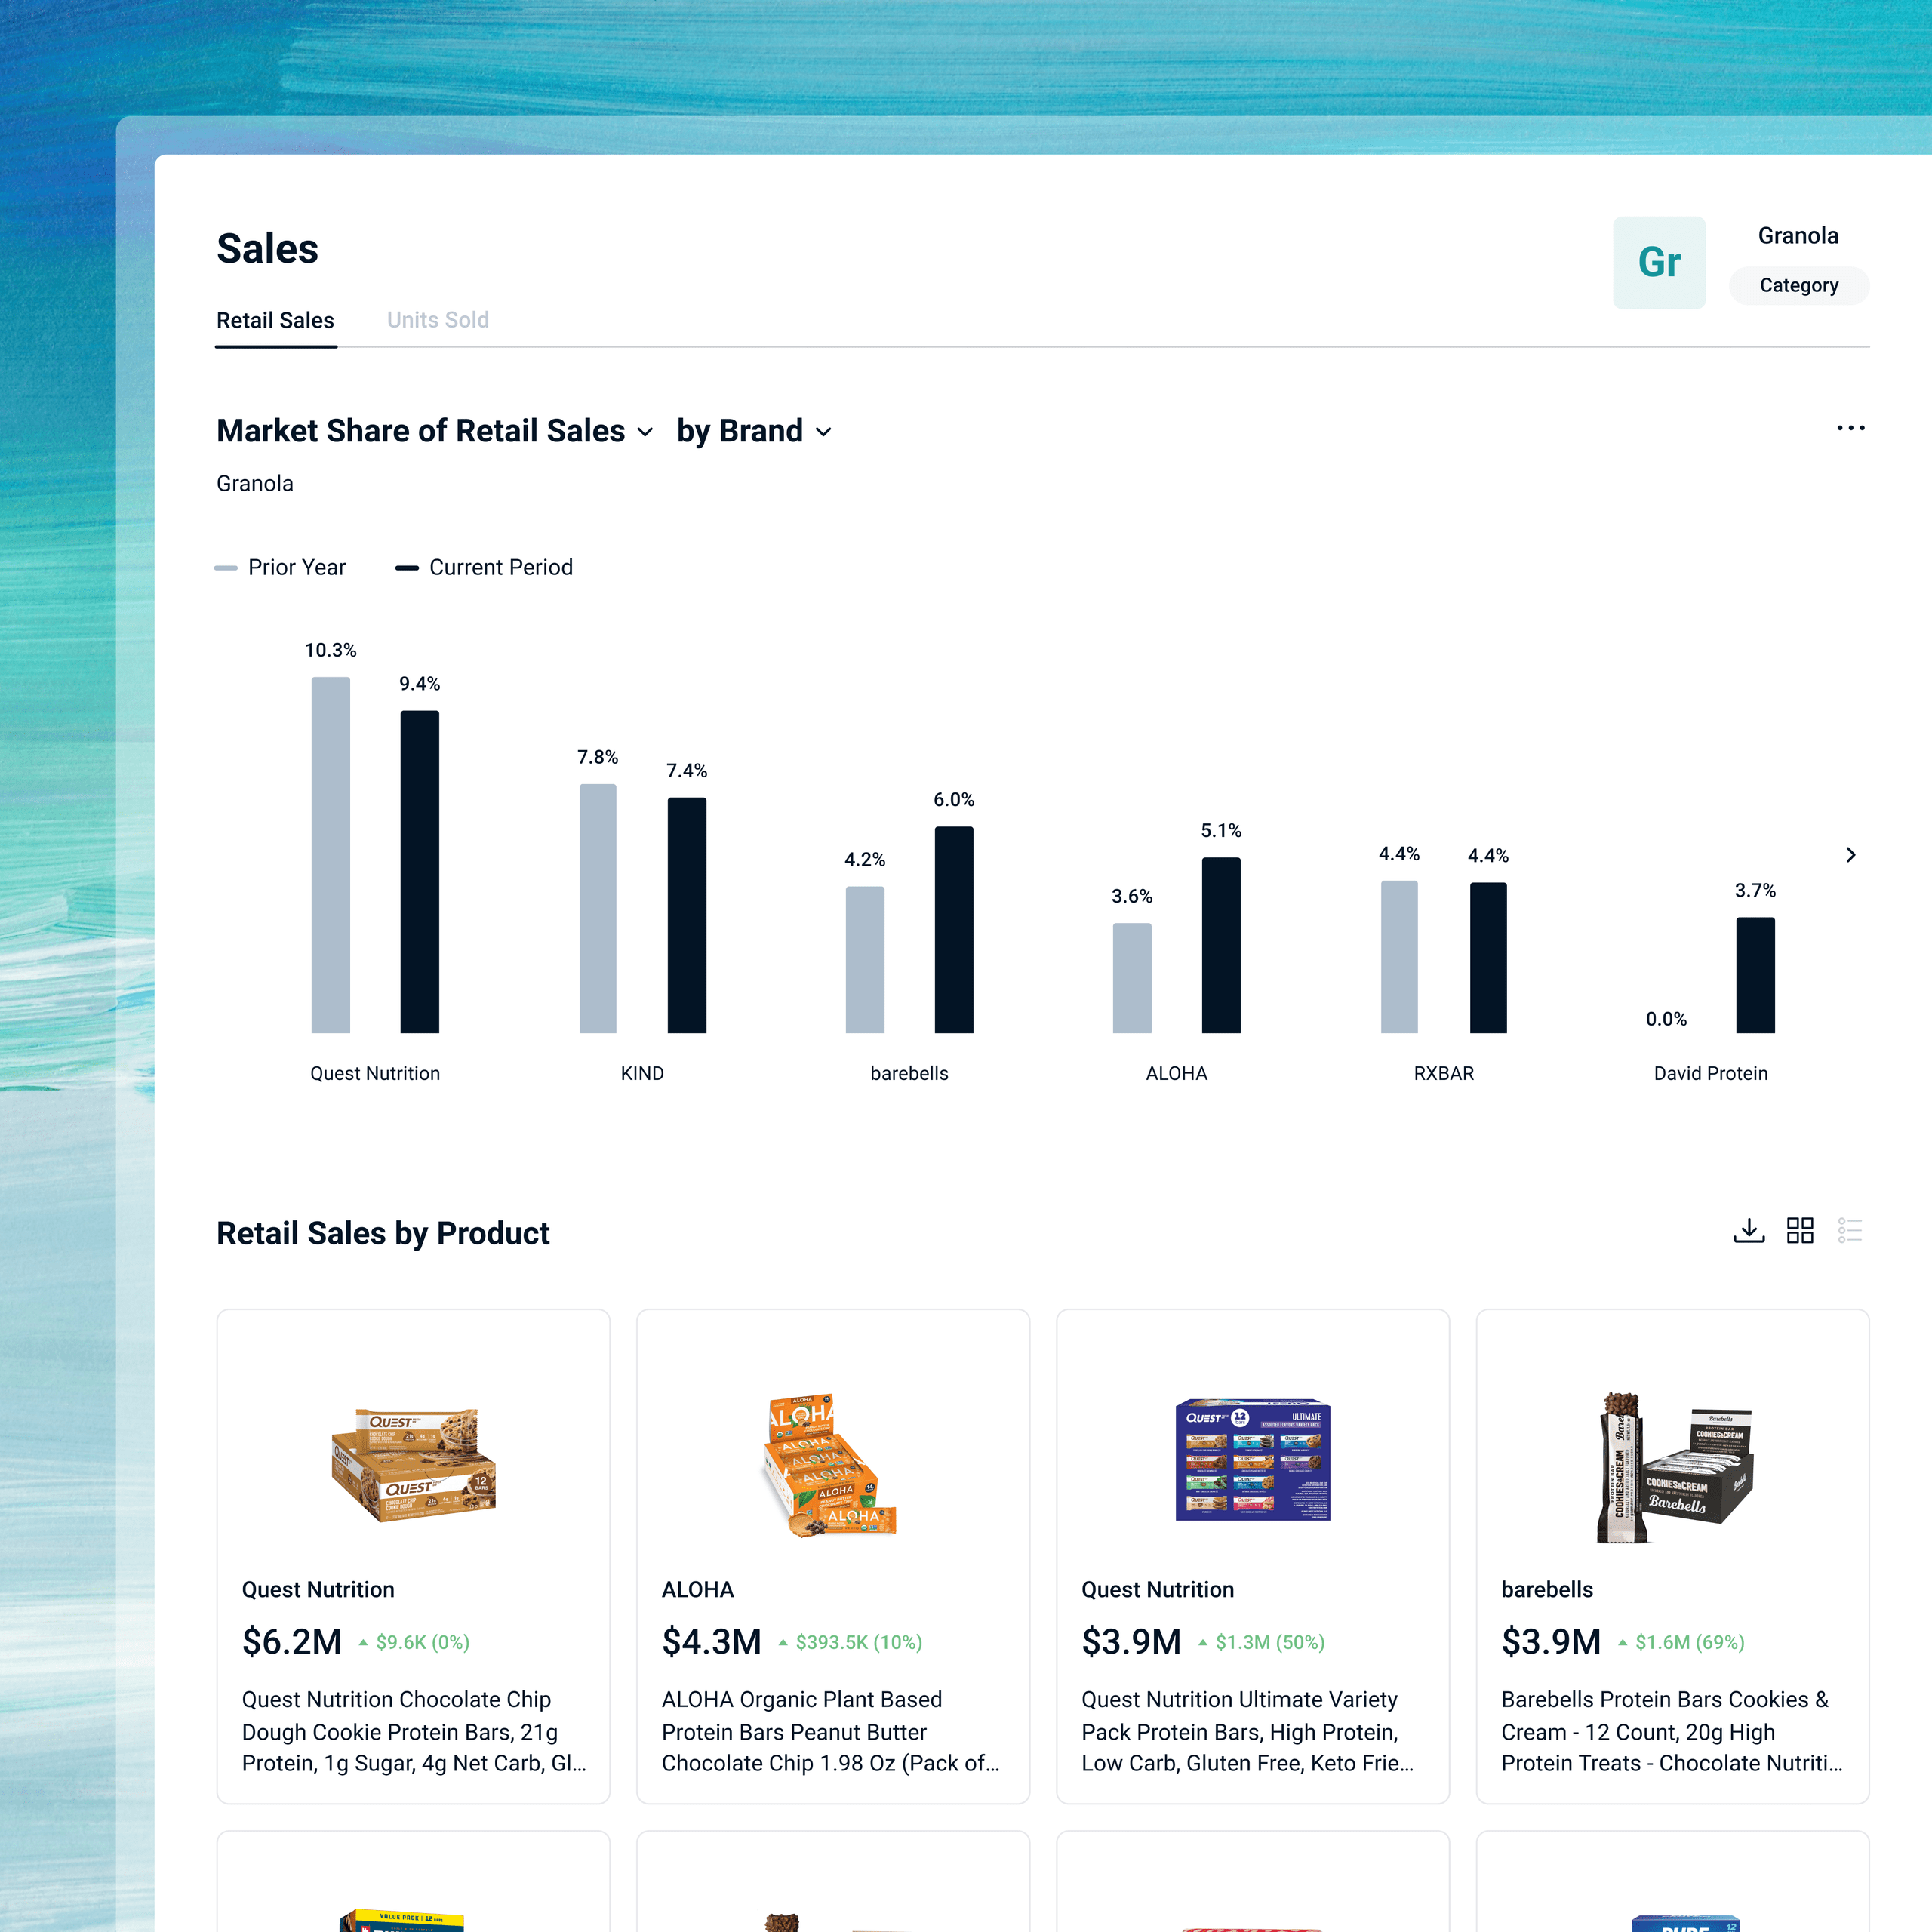
Beacon looks at the operating business: sales, marketing, inventory, and forecasts. Its 52-week projections reach individual SKUs. Scenario planning lets teams compare possible advertising and promotional decisions. The forecast becomes something colleagues can question together, rather than a spreadsheet passed between departments with different assumptions.
- 01See the marketAtlas
- 02Plan the responseBeacon
- 03Run the campaignAd Manager
Ad Manager handles campaign controls such as bids, budget pacing, and dayparting. Shopper Analytics examines switching, retention, and audience behavior across retailers. Shopper OS adds customer engagement tools, including rewards and reviews. Advisor supplies an AI interface for analysis, recommendations, and content work.
The offer includes people. Stackline sells advertising management, content support, research, and other professional services alongside subscription software and data. Customers buy an agreed scope through order forms. A sensible cost comparison includes the subscription, services, media budget, and the internal time needed to use the output.
The stroller needed better words
UPPAbaby offers a concrete example of that working arrangement. Its offline retail experience had not translated cleanly to Amazon. The company used Atlas to benchmark merchandising, then Beacon Pro to identify important products with weak content. Its team rewrote titles, bullets, and descriptions using search and shopper insights.
Stackline’s services team worked on advertising in parallel, auditing keywords and competition before managing campaigns with automation. The published case reports conversion rising 27%, cost per click falling 68%, and return on ad spend increasing 224%. These are vendor-published results from a combined intervention, so the numbers should travel with that context.
The repeatable move is refreshingly ordinary: inspect the page before buying more visitors. Choose high-volume products with fixable weaknesses. Improve the information. Reassess the advertising. Give someone responsibility for carrying the findings into the next round of work.
Now the shelf can answer back
Stackline occupies crowded territory. CommerceIQ also connects retail operations and media; Pacvue offers commerce media automation; Profitero+ covers digital shelf intelligence. Stackline’s particular pitch combines competitive measurement, shopper data, execution tools, and services. Buyers should compare the actual retailer coverage and work involved in a specific use case.
That work continues to change. On October 14, 2026, Stackline announced Gemini data inside AI Visibility, covering shopping questions, product recommendations, and impression share. The familiar retail question now applies to an assistant’s answer: when a shopper describes a need, does your product appear?
A team with little cross-retailer activity may have less to gain from this breadth. Even a large brand needs connected data, people able to act, and disciplined evaluation. Stackline’s enduring proposition depends on those conditions: follow the customer far enough to ask a better question, then put the answer to work.