Julius AI is for the person staring at a workbook named FINAL_v7_ACTUAL.xlsx and wondering whether Tuesday is too early to resign. Upload the file, ask a plain-English question, and Julius can inspect the tables, write Python or R, run the code, explain the result, draw a chart, and package the work into a report or presentation. That is a useful reduction in ceremony. It lets operators, marketers, founders, finance teams, researchers, and students get to a first answer before a traditional analytics request has found its way onto somebody’s backlog.
The fit is less convincing for a seasoned data scientist who already has a tested notebook, a governed semantic layer, and strong opinions about joins. Julius can still accelerate exploration, but its real constituency is the curious person with data in hand and no desire to become fluent in pandas by lunch. Founder Rahul Sonwalkar said the company originally expected analysts and data scientists. Instead, it found people who had questions and lacked the specialist skills to answer them. That observation still explains the product better than its expanding menu does.
Why it exists: skip the syntax
Julius launched in 2023 after Sonwalkar pivoted from the logistics company he had taken through Y Combinator. The early build was gloriously plain: emoji for interface icons, plus tools to read a file and run Python. The important idea was already present. A language model would translate intent into executable code, inspect the result, and try again when needed. Each user received an isolated sandbox with compute and file storage. R kernels arrived after users kept asking for them, even though Sonwalkar joked in a 2024 interview that nobody on his team knew R.
That code loop separates Julius from a chat bot that merely describes what a calculation might look like. It can perform the calculation, produce an artifact, and expose the route it took. The current version adds SQL generation, direct warehouse connections, reusable Notebooks, scheduled reports, and a Learning Sub Agent that builds knowledge about schema relationships. Julius says that learner focuses on structure and business context, not actual data values.

“The easiest way to use Julius is to just talk to it.”Rahul Sonwalkar, founder and CEO, speaking to TechCrunch
What it does now
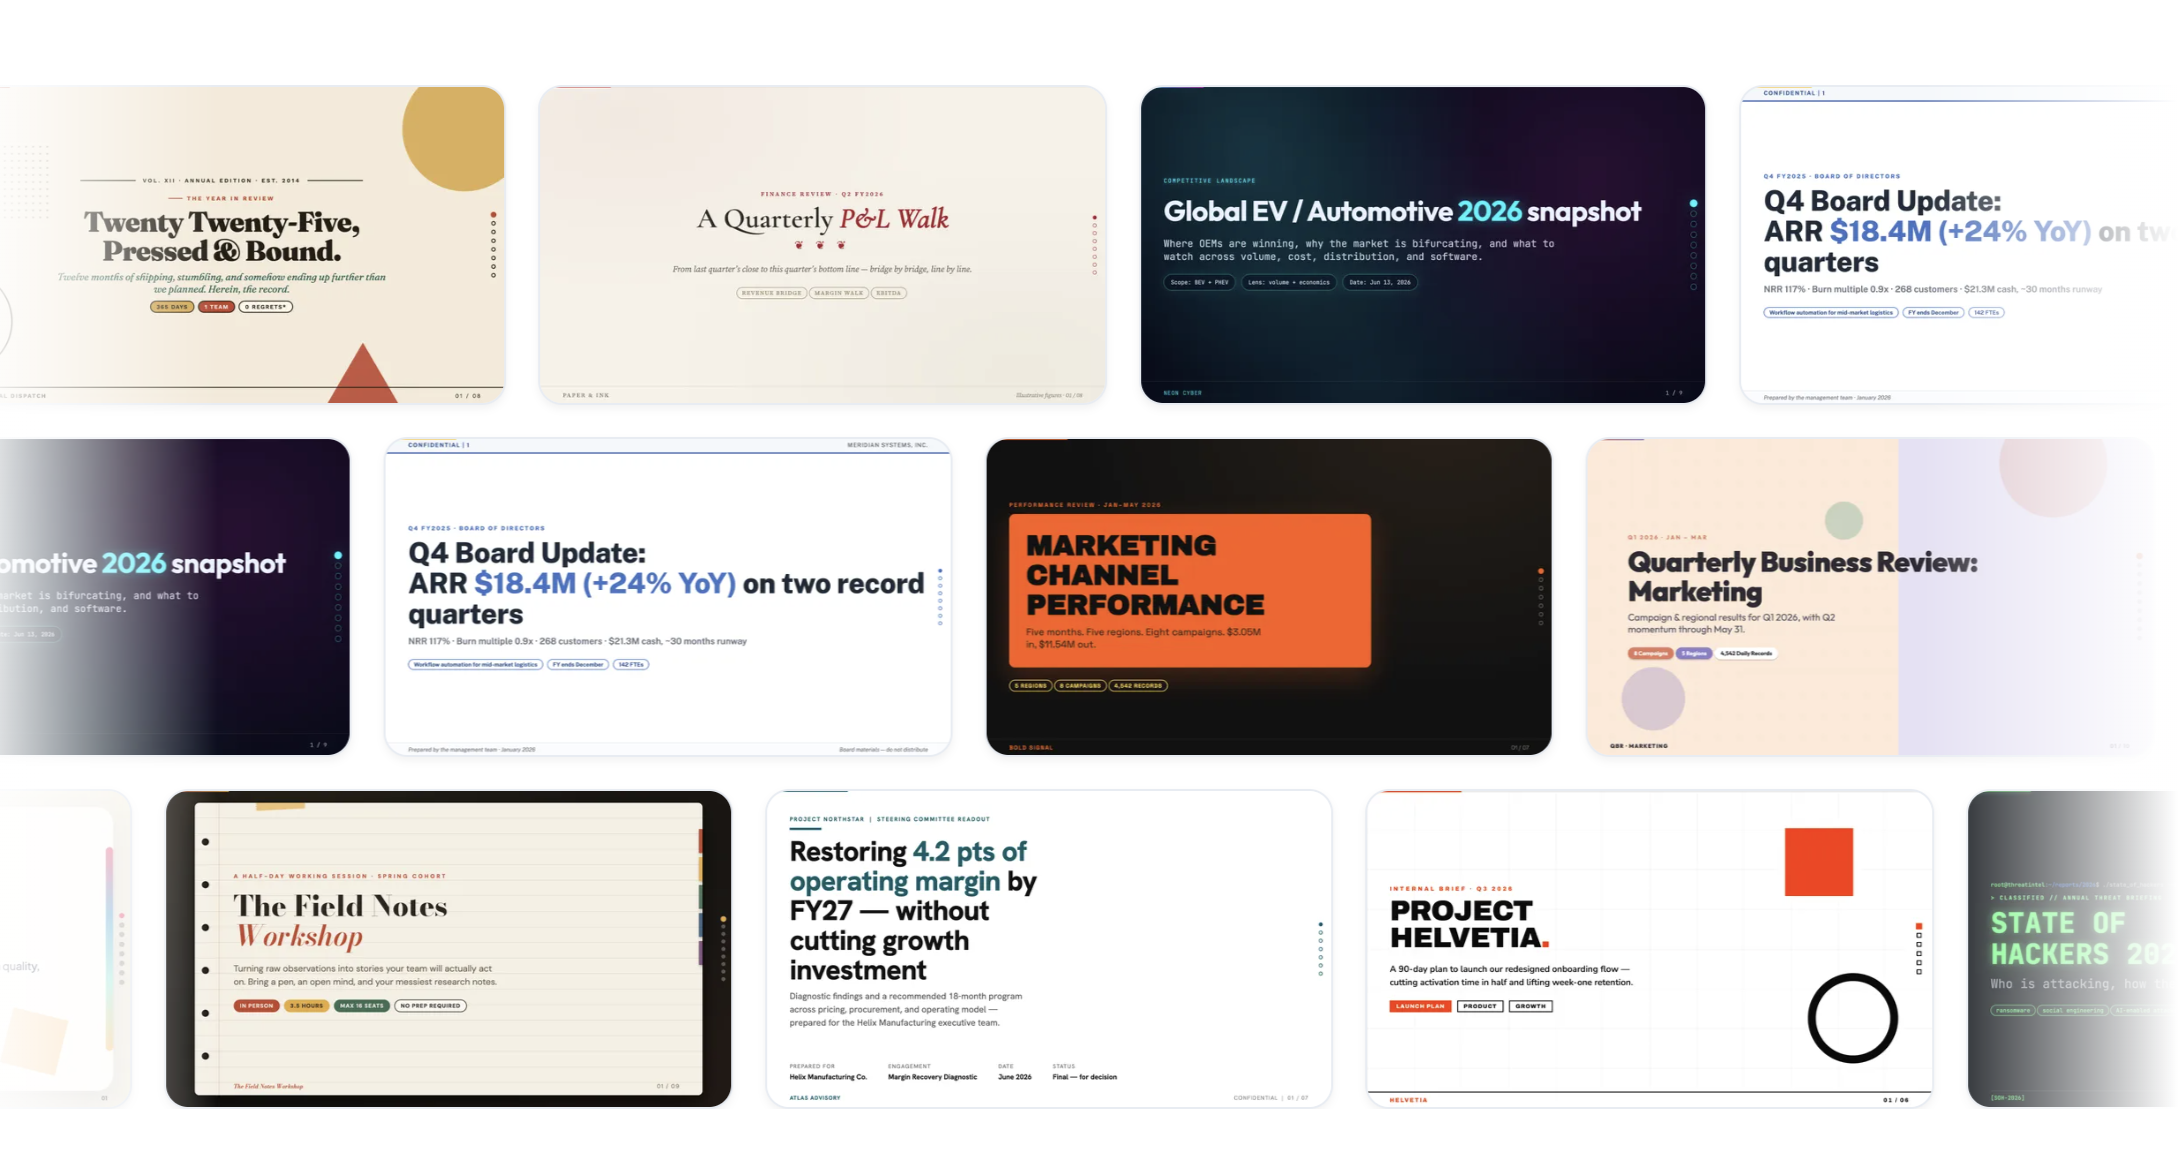
Calling Julius an “AI data analyst” is accurate but incomplete. The product now pitches itself as a workspace for research, analysis, and creation. It can begin with a spreadsheet, PDF, document, image, question, or connected database. From there it can make charts, run regressions and forecasts, write a report, build an editable PowerPoint or Google Slides deck, publish a website, and generate images or video. In August 2026 the company also announced a Browserbase-powered Browser Agent able to take actions on the web.
The useful chain
The product is most coherent when those steps stay connected. A finance lead can ask about net revenue retention, challenge the fitted curve, and turn the accepted analysis into a board slide without pasting screenshots between six apps. A growth manager can connect advertising data, compare acquisition cohorts, and schedule the same report for next Monday. A professor can teach regression without spending half the lesson debugging a local R installation.
| Job | Where Julius helps | Where you step in |
|---|---|---|
| Spreadsheet triage | Profiles files, filters rows, joins tabs, spots patterns | Define clean units, dates, and business terms |
| Analysis | Writes Python, R, or SQL and runs statistical methods | Approve method, assumptions, and edge cases |
| Visuals | Builds charts and responds to design revisions | Check axes, denominators, labels, and omissions |
| Delivery | Exports reports, PPTX, PDF, PNG, Google Slides, and files | Edit voice, context, and executive conclusions |
The review: quick hands, occasional butterfingers
The strongest public praise concerns speed and approachability. Julius’s funding announcement quotes a Spellbook finance executive saying the product clarified long-term cohort trends for planning. On the current product page, users describe drilling into large datasets without waiting on engineering. The more charming case comes from a 2024 founder interview: a Midwestern hot-tub company kept nearly a decade of weekly sales in one Google Sheet, and Julius reportedly picked up the seasonal pattern. Apparently autumn is when America looks at its patio and thinks, yes, soup for people.
Independent discussion is pricklier. Data professionals on Reddit question whether a general instruction such as “analyze this data” contains enough business context to produce a trustworthy answer. A critical community-forum post complained that Julius generated visualizations when coefficients had been requested. A detailed 2026 third-party review reported good results on straightforward analysis but hallucinated columns during more complicated joins. These are not reasons to dismiss the product. They are reasons to treat the conversational layer as an accelerator, not an oracle.
Use it for
- Fast exploration of a new workbook
- Repeatable charts and weekly summaries
- Draft analysis for nontechnical teams
- Turning accepted findings into slides
Slow down for
- Complex joins with unclear relationships
- Regulated or high-stakes decisions
- Ambiguous metrics and mixed units
- Any chart going to the board
How to get a result worth keeping
Begin with a small, legible sample and a question that contains a metric, a time range, and a decision. “Compare monthly gross margin by region for 2025, explain how you handle refunds, and flag missing values before calculating” is far better than “find insights.” Tell Julius which tab is authoritative. Define whether revenue is booked, billed, or collected. Ask it to show the generated code and list assumptions before drawing conclusions.
Then interrogate the answer. Ask which rows were excluded, whether dates were parsed consistently, and whether a percentage is weighted. Reproduce one critical number in Excel, SQL, or a calculator. If the dataset includes a stray 65,000 in a column measured in thousands, a polished deck can turn it into a spectacularly wrong story. Export only after the logic survives that inspection. Julius’s own graphing guide recommends checking how the question and data were interpreted, which may be the most useful sentence in its documentation.
Price and the crowded bench
Julius uses credits. The free plan includes daily credits and limited creation. Plus costs $20 monthly, or $16 a month billed yearly, with 2,000 monthly credits. Pro is $45 monthly, or $37 annually, with 5,000 credits and more context. Max is $200 monthly, or $166 annually, with 25,000 credits. Business is $450 monthly, or $375 annually, with 60,000 credits and up to 50 members. Enterprise is quoted. Since March 2026, tasks consume different amounts based on their compute demands, so “how many things can I make?” no longer has one tidy answer.
The obvious rival is ChatGPT’s data analysis, especially for someone already paying for it. Claude and Gemini can also reason over files and generate code. Power BI and Tableau remain stronger choices when governance, durable dashboards, and established enterprise workflows matter. Gamma competes on presentation creation; Bricks and Quadratic approach spreadsheets with AI-native interfaces. Julius earns its place when the path from raw file to analysis to presentable artifact matters more than owning the deepest tool in any single category.
The small company with the big Roman bit
Julius announced a $10 million seed round led by Bessemer Venture Partners in July 2025. The round also included Y Combinator, Horizon VC, AI Grant, 8VC, and founders from a conspicuous list of software companies. At the time, Julius said more than two million people had generated over ten million visualizations and that the system wrote four million lines of code daily. Harvard Business School had used a tailored version in a required course for more than 900 students.
There is a comic footnote. Sonwalkar was one of the pranksters who appeared outside Twitter headquarters in 2022 pretending to be a laid-off engineer named “Rahul Ligma.” The gag traveled much farther than anyone expected. The serious company that followed is Julius, branded in places under Caesar Labs. Even the corporate paperwork is staying in character.
Verdict
Julius is an appealing answer to an ordinary office problem: the distance between having data and having someone available to examine it. It lowers that distance without pretending the underlying work has become simple. Its breadth is impressive, but the sharpest part remains the original one: talk to your data, watch code do the work, and refine the answer in conversation.
For nontechnical operators and analysts who spend too much time shuttling between spreadsheets, notebooks, chart tools, and slides, that can be worth paying for. For experts, it is a fast junior collaborator with infinite patience and no instinct for when the meeting is too important to bluff. Give it the messy job. Keep the final signature.