Climate Central had learned to distrust a tempting idea: make the graphic interactive. Its older tools had left broken graphics on the website, and updating them was awkward enough that the team became wary of adding more. A chart, apparently, could acquire an afterlife as an unpaid maintenance assignment.
- Observable puts code, data, and live graphics in collaborative documents.
- Its open tools let developers move from an experiment to a published data app.
- Its AI story includes an instructive reversal: protecting existing work created clutter.
- Free libraries sit beside paid plans for the hosted notebook platform.
That maintenance problem is a good entrance to Observable. The San Francisco company makes tools for people who need to explore numbers, explain what they find, and let somebody else examine the result. The work might be a scientist’s explanation, an analyst’s dashboard, or a map a journalist embeds in a story. The common problem is the handoff. An answer has to travel without losing its workings.
A chart with an afterlife
Climate Central’s team used Observable notebooks to prototype interactive maps. When it built a nationwide urban heat product, it moved to Observable Framework: the spatial files exceeded notebook attachment limits, and a multi-page app offered a cleaner experience for readers. The customer account describes transferring the prototype, refining the presentation, and publishing the app. Colleagues could more easily change the work afterward.
There is a practical lesson here. The cost of a graphic includes the next revision. A tool that makes the first version delightful but leaves one person able to repair it has merely postponed the difficult part. Climate Central’s example makes maintainability a purchasing criterion, alongside whether the map looks good.
The notebook that could not be everything
Observable’s ancestry explains its taste. Co-founder Mike Bostock created D3, the JavaScript visualization library. Co-founder Melody Meckfessel had spent years in engineering at Google. Together, their company brought visualization and collaboration into the same conversation. In January 2022, it raised a $35.6 million Series B led by Menlo Ventures, with Sequoia Capital and Acrew Capital participating; contemporary reporting put total funding at $46.1 million.

But pedigree does not spare a product from an awkward discovery. In his February 2024 Framework announcement, Bostock described the original hope that notebooks could serve notes, apps, dashboards, and reports. Their narrow layout and visible editing controls worked well for tinkering. They were less persuasive as a finished presentation. The company had to give the audience a different interface from the author.
“Our mission is to help teams communicate more effectively with data.”Mike Bostock · Framework announcement · February 2024
Framework answered that problem with files, a command-line workflow, and a static website. The broader lesson travels well beyond analytics: a useful workbench need not resemble the thing you carry into a meeting.
Two ways to draw, several ways to publish
Start with the drawing tools. D3 supplies low-level control over custom graphics: scales, shapes, layouts, maps, and interaction. That flexibility suits a developer with an unusual explanation to build. It also asks the developer to make choices a conventional chart menu has already made.
Observable Plot, introduced in May 2021, operates a level higher. Built on D3, it helps people try charts with concise code. Its marks include dots, bars, and lines; transformations and facets help turn a dataset into comparisons. Plot does not require an Observable subscription. Neither does D3. These are public building materials, useful beyond the company’s own platform.
Framework puts those materials into apps. Its data loaders prepare snapshots before publication, using languages such as Python, R, or SQL. The browser then receives prepared data and an interactive page. Developers can keep the project in version control and host the built site where they choose. This architecture removes work from the moment a reader opens the page.
during the build
with the site
in the browser
A snapshot’s freshness depends on when it was built. Speed does not make old data new.
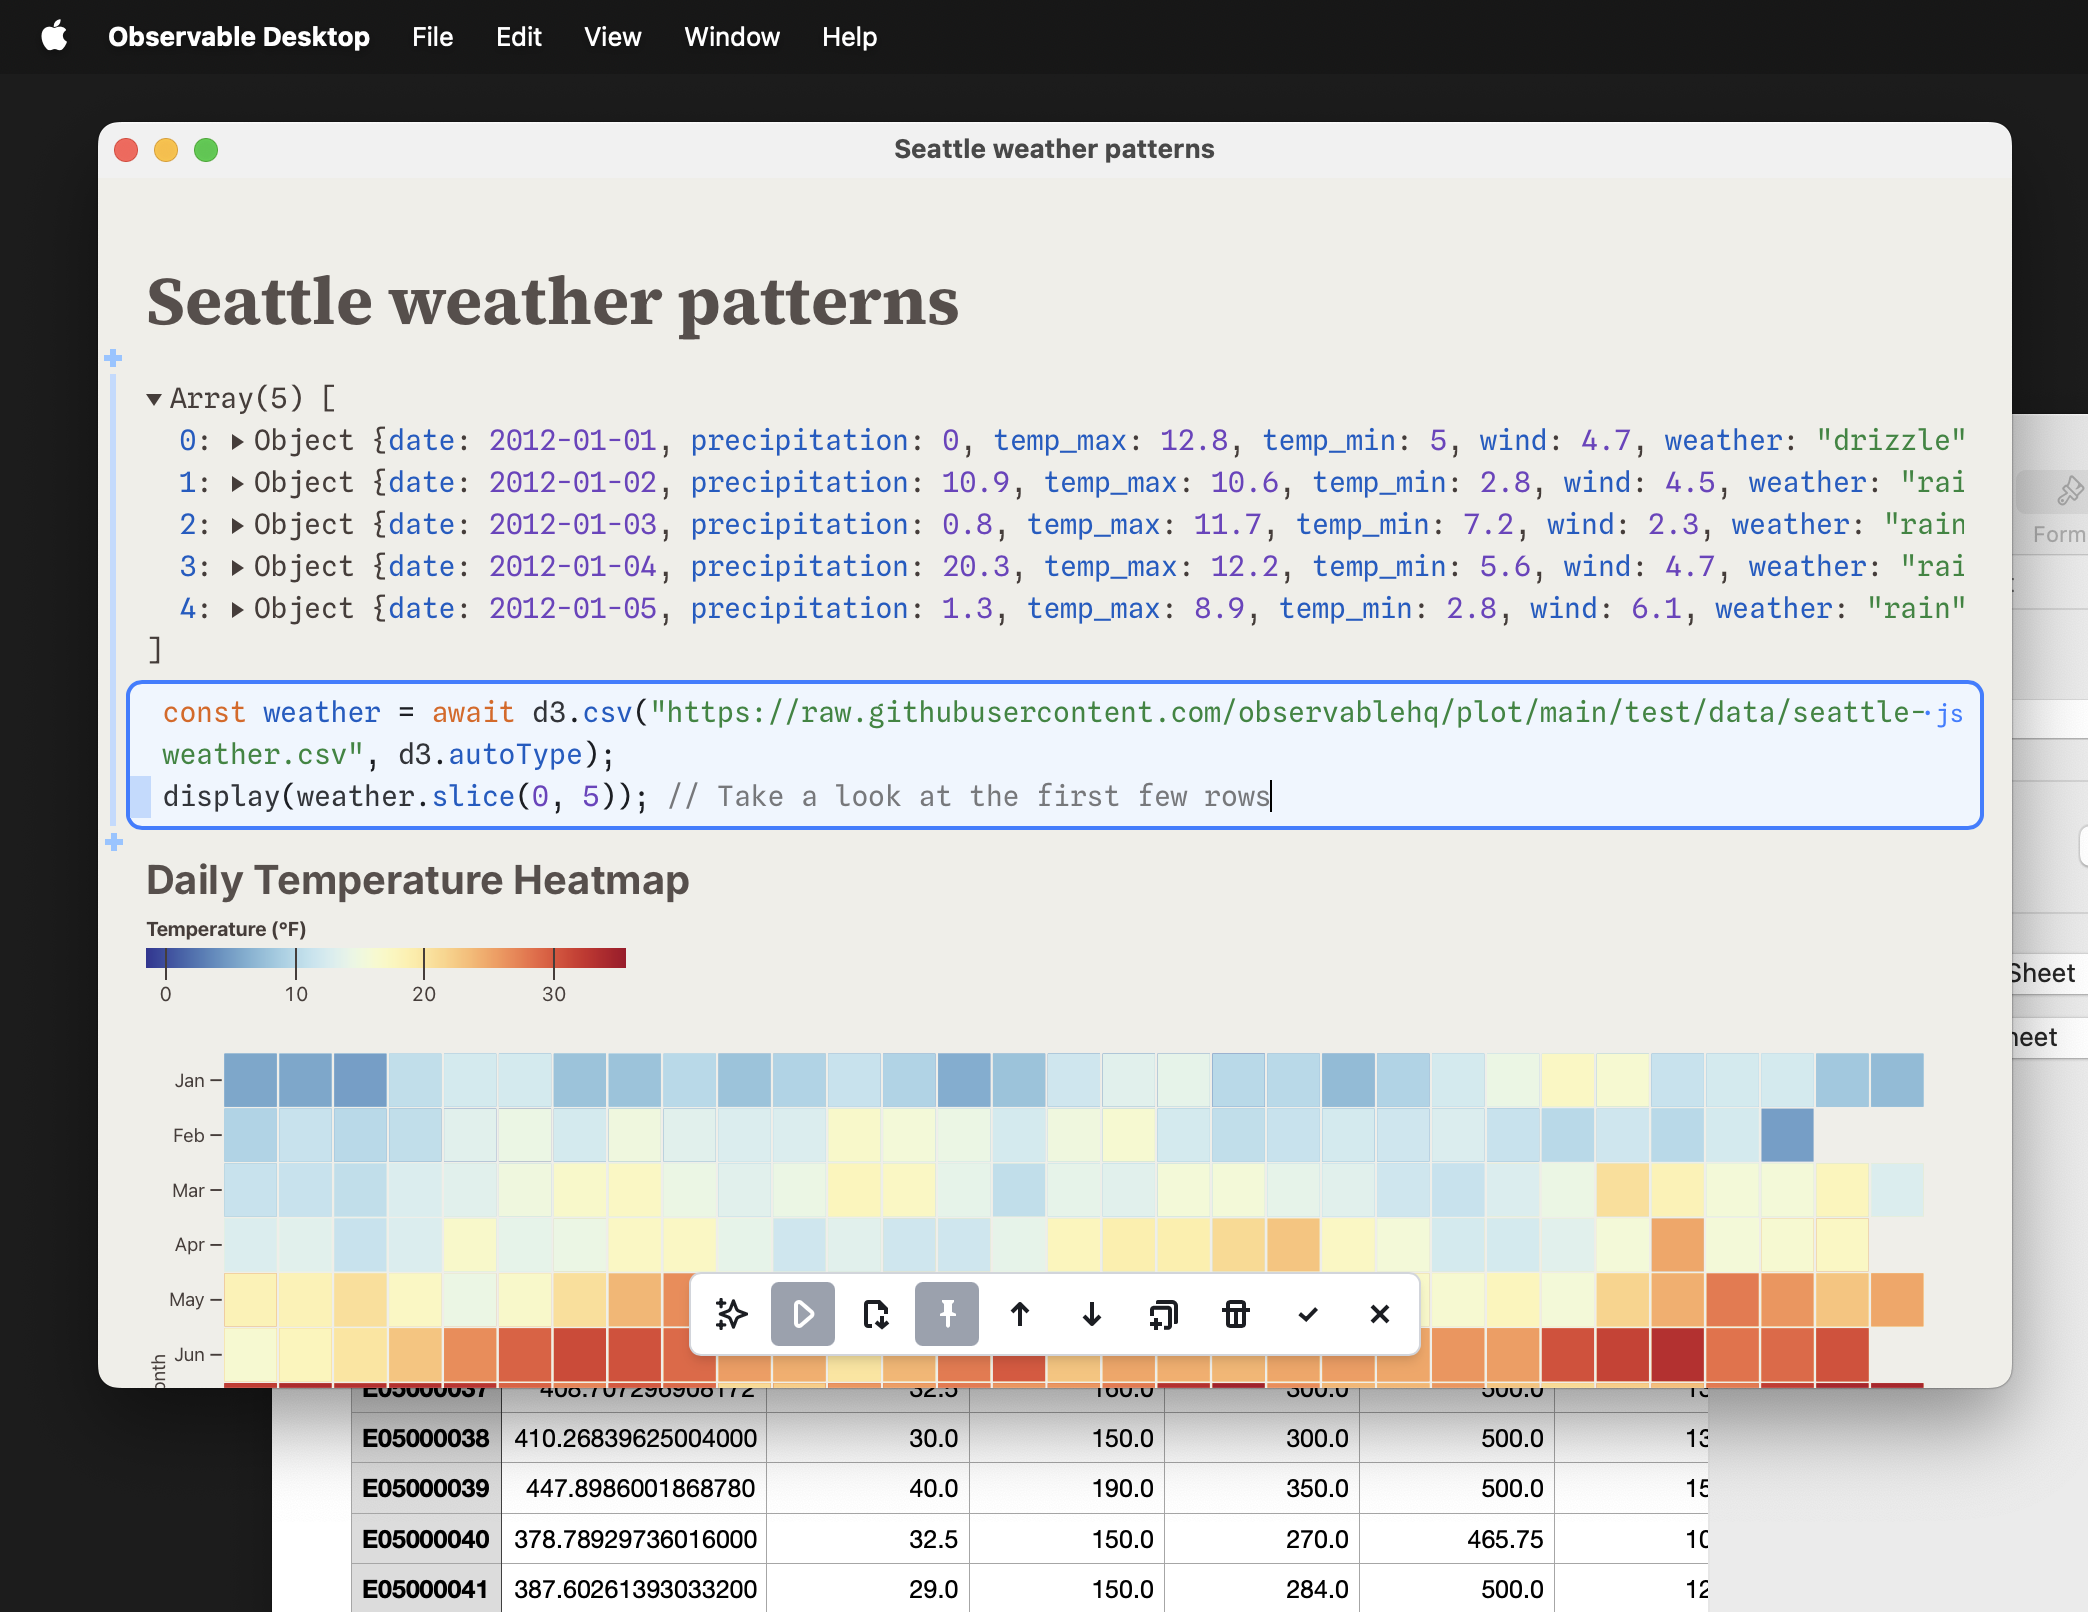
Notebook Kit offers another publishing route, built around an open, readable notebook file format. The newer notebooks adopt ordinary JavaScript and can be edited as local files; Observable Desktop supplies a macOS editor. A team can choose the convenience of shared web editing or bring its own file-based workflow. That freedom matters when a promising experiment becomes something colleagues depend on.
When a careful AI became a messy colleague
In April 2025, Observable opened early access to Canvases, collaborative whiteboards for data exploration. Analysts could connect tables, queries, and graphics across a visual workspace, mixing interface controls with code and AI. It was another attempt to make the intermediate steps of analysis visible.
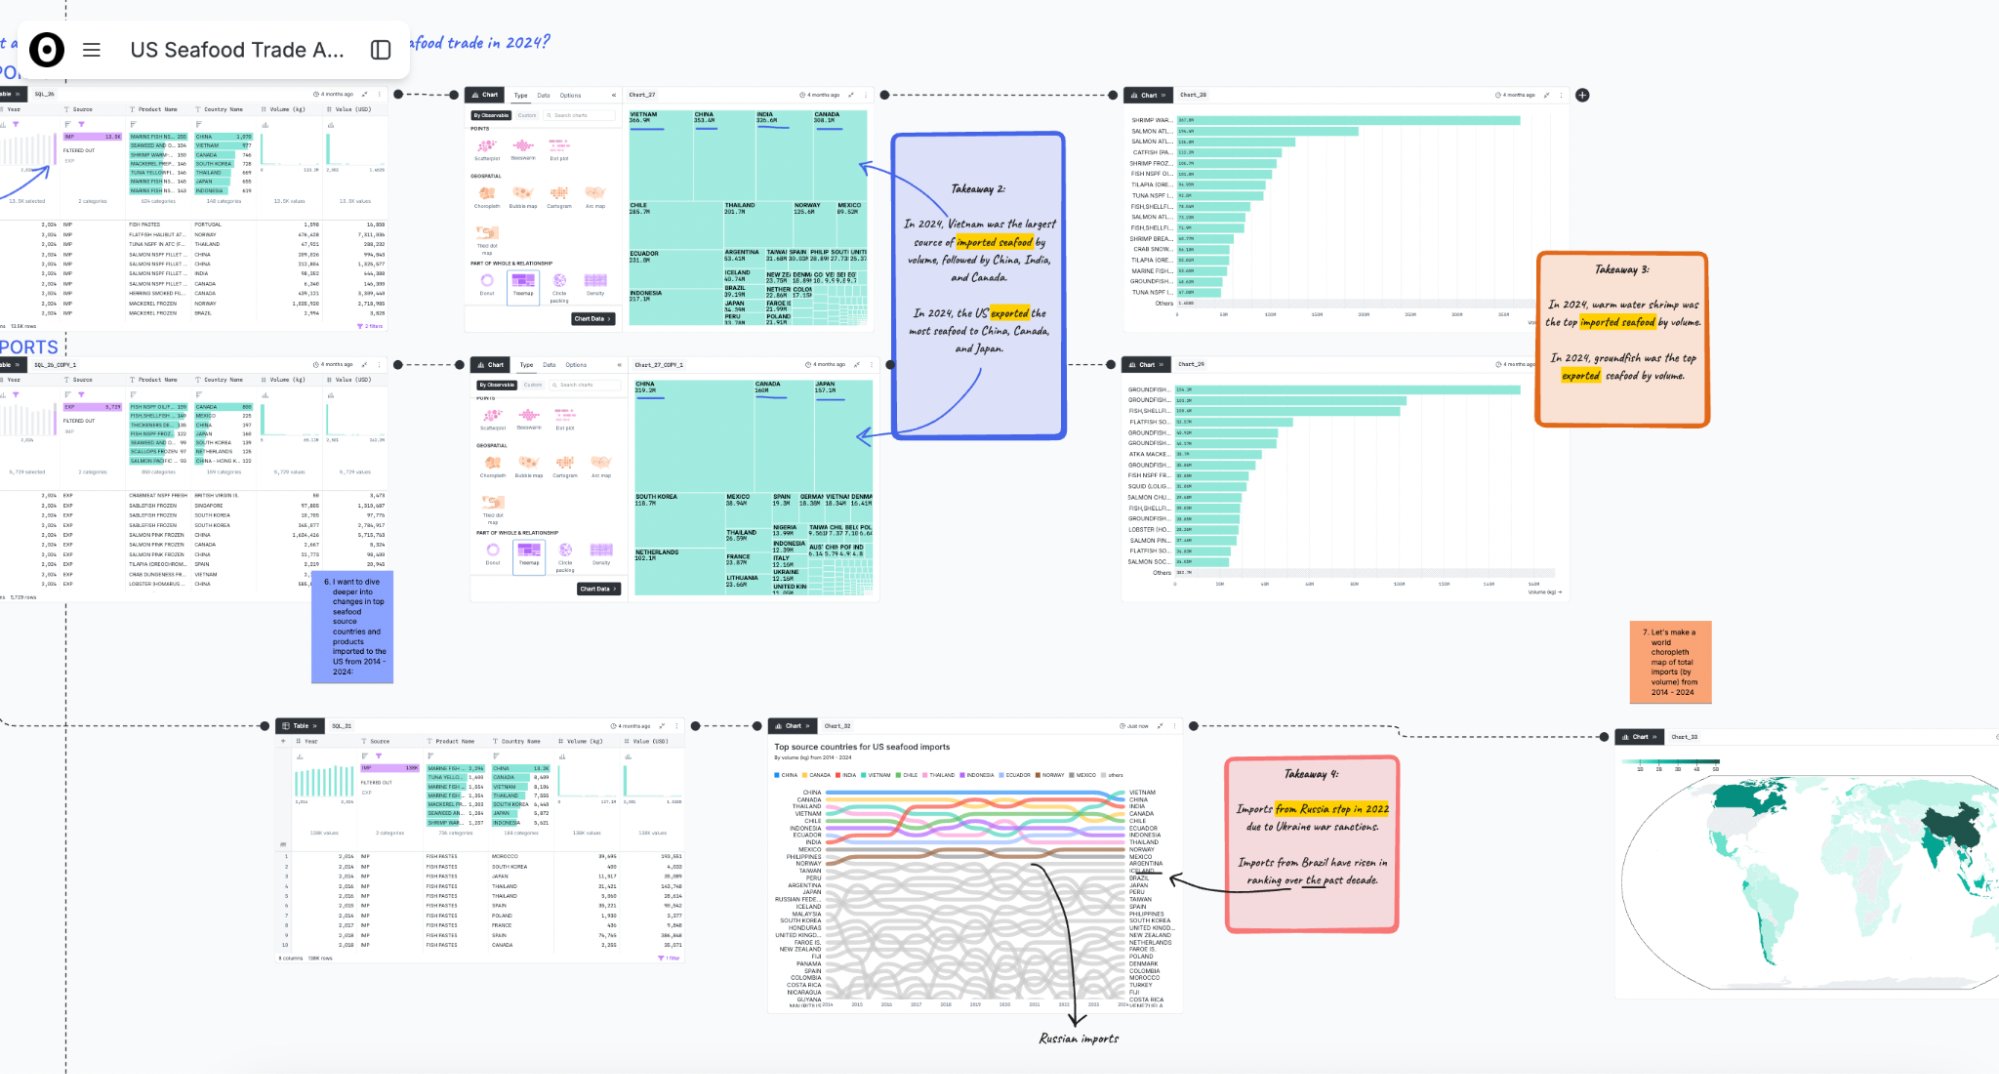
One early AI rule sounded sensible: do not edit existing canvas content. Generate a new SQL node instead. The company’s December 2025 account describes the consequence. Small changes accumulated new nodes, unnecessary queries crowded the canvas, and performance suffered. A precaution against unwanted edits had acquired a cost of its own.
The response was to narrow the scope. January 2026 release notes announced AI editing directly inside a SQL node, with changes the user could accept or reject. The copyable idea is specific: give assistance a defined place to work and give the person a decision about the change. A blanket rule can be reassuring on paper and cumbersome in daily use.
By September 2026, Observable’s main site puts notebooks, chat, and an agent at the center of its pitch. It describes an agent able to inspect runtime values and interactive selections. The consistent interest is in an answer whose components remain within reach. An inspectable query still needs someone who understands what a correct query would mean.
The map, the building, and the bill
The buyer is not always buying a chart. Smplrspace, which builds digital twins of buildings, integrated its JavaScript floor-plan library with Framework. The two companies co-developed a demonstration connecting indoor carbon dioxide measurements to spatial views. Smplrspace also used Observable for internal metrics and to model a repricing strategy. The same tools could face the customer or the business team.
“I see Observable as a BI stack”Thibaut Tiberghien · CTO, Smplrspace
This helps locate Observable in a crowded market. Tableau and Power BI belong on a business dashboard shortlist; Jupyter belongs on a computational notebook shortlist. Streamlit, Dash, and Quarto are further alternatives when the job is publishing an analysis or data app. Those categories overlap. Observable’s appeal is strongest when the team wants browser-based exploration, custom visual explanations, and a path into reusable web work. That is an editorial reading of its products, rather than a claim that every competitor lacks those qualities.
*Listed rates; monthly billing is $25 and $45 respectively. Free plan available. Enterprise pricing is custom.
The business model pairs open tools with a paid hosted service. Current notebook plans also list Team private viewers at $10 per viewer per month. Those are software fees; any database, hosting, or staff costs in your own setup belong in the calculation too. For five Team editors on the listed $40 rate, the arithmetic is $200 a month before viewers and other costs. These prices describe the current notebook offering, not every historical canvas or cloud package.
Borrow the workflow, not the certainty
A team trying Observable can begin with one question and a dataset small enough to inspect. Keep the definitions beside the code. Ask a colleague to change an assumption. Publish a version only after deciding who maintains it and how the data refreshes. This is a proposed trial, not a promise of a particular productivity gain.
The conditions matter. A browser is a finite machine; a 2024 forum discussion describes a large CSV overwhelming a notebook and suggestions to pre-aggregate or partition it. A snapshot-based app needs a refresh plan when the answer is time-sensitive. Custom visualization still needs technical judgment. If nobody owns the data definitions, a collaborative interface can spread a misunderstanding quite efficiently.
Observable’s useful proposition is that the steps can stay visible long enough for someone to question them. The finished chart may be handsome. Its working parts are what make it worth passing along.
Open a notebook. Follow a thread.
Try the website, browse GitHub, read the blog, or join the forum.
Follow LinkedIn, X, Bluesky, Instagram, and Facebook.
Watch the What’s new in Canvases demo or the Observable development podcast. Read the 2022 financing coverage.