A data grid has the glamour of a filing cabinet. It contains rows. It contains columns. Someone will inevitably want to sort them. Yet the moment those rows describe a trading position, a machine fault, or a customer’s inventory, the filing cabinet acquires responsibilities. It must be quick, legible, editable, and difficult to misunderstand. Infragistics has made a long business out of taking that apparently modest object seriously.
- It sells the parts: interface controls that developers put inside their own applications.
- Its useful territory: data-heavy enterprise software, where grids and charts do real work.
- Its expansion: visual app building, embedded analytics, and work management.
- The buying decision: whether a license costs less than another round of building and maintaining the same machinery.
01The product that was too close to the compiler
In a 2001 newspaper interview, Dean Guida recalled an earlier predicament: a C++ visual development tool accounted for 80% of revenue, then Microsoft and Borland entered that territory. Sales were still healthy, but the threat persuaded him to develop other products. He began making components. The predecessor, ProtoView, later merged with Sheridan Software to form Infragistics.
That is a useful distinction. A healthy sales report can conceal a weakening position. Selling pieces gave the company a different relationship with the software platforms around it.
“Building a better product is your ticket to the game.”
Dean Guida, speaking in 2001
Guida’s more recent account adds the less romantic arithmetic. He says he and Don Preuninger started with $25,000, kept their day jobs, and coded at night. Before that, Guida worked as a freelance developer on Wall Street. This was a business built around other people’s software problems from the beginning.

02A train is a stern design critic
ABB’s traction software makes the abstraction concrete. Engineers use it to visualize signals from train power converters. In Infragistics’s published customer story, ABB chose new controls to modernize that software; product owner Vinil Sarode reported faster loading of live data and more flexible chart displays. Users could split the display and add markers, labels, or narration.
Those are small interface decisions with a clear purpose: help someone interpret a signal. A chart that looks handsome in a sales presentation still has to earn its keep while data is moving.

Bently Nevada, a Baker Hughes business, offers another example. For its Orbit 60 condition-monitoring platform, it needed visualizations that could handle streaming industrial machine data. It selected Ultimate UI for WPF after evaluating alternatives. The published account emphasizes flexible grids, custom cell editing, and the ability to work with complex domain data.
This is the company’s natural habitat: applications whose users already have complicated jobs. The interface should spare them an additional one. Its published customer roster also reaches finance, energy, transport software, and social-service case management. The pattern is more revealing than a wall of famous logos.
03The handoff gets its own product
The component business addresses one kind of repetition. App Builder addresses another: the journey from a design to an implemented screen. A designer draws a layout. A developer reconstructs it. The reconstruction acquires a different spacing, a missing state, or an argument about what the prototype meant. Nobody ordered the argument, but everyone pays for it.
App Builder provides a visual drag-and-drop environment, templates, data binding, themes, and generated source code for supported web frameworks. Teams can preview the code while working and move it into their development environment. An on-premises version gives organizations another deployment option. The important promise is a shorter passage from layout to usable implementation.
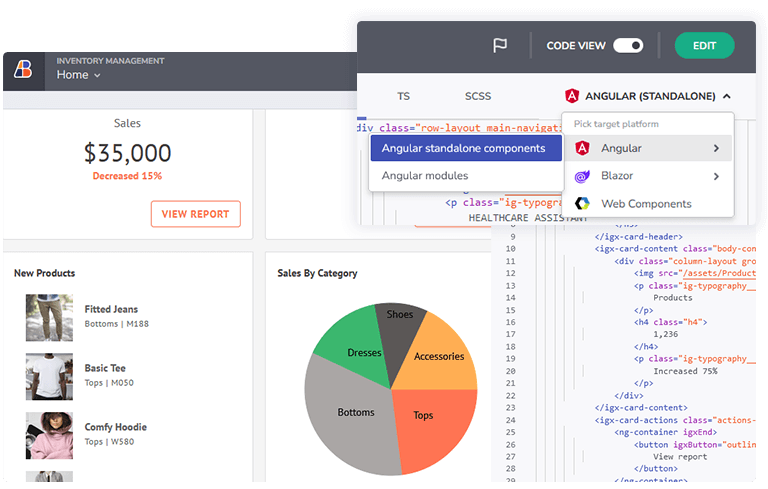
Two sibling products extend the same instinct. Reveal supplies SDKs for embedding dashboards and analytics inside another software product, with white-label presentation and cloud or on-premises deployment. Slingshot connects analytics with work management; its current pitch focuses on marketing teams linking performance, pipeline, campaigns, and ownership. One makes information available inside an application. The other puts the resulting work beside the information.
Ignite UI / Ultimate UI: reusable grids, charts, and controls for supported web and Windows platforms.
04A subscription to somebody else’s edge cases
The commercial logic is straightforward. Developer bundles are sold as royalty-free subscriptions priced per developer. On the official pricing page checked for this profile, a one-year Ignite UI subscription is $1,399, Professional is $1,599, and Ultimate is $2,399. Ultimate includes App Builder. Multi-year terms reduce annual prices; priority support adds $300 a year.
| Bundle | Annual price |
|---|---|
| Ignite UI | $1,399 |
| Professional | $1,599 |
| Ultimate | $2,399 |
Listed prices checked October 1, 2026. Optional support, taxes, and custom enterprise terms can change the total.
For illustration, five Ultimate seats at that listed rate cost $11,995 per year before extras. That calculation tells a team what to compare with its own engineering costs; it does not tell it how many hours it will save. Reveal has a different model: fixed-price quotes with unlimited end users.
Progress Telerik, DevExpress, and Syncfusion sell overlapping component suites. Infragistics’s case rests on its combination of web controls, Windows controls, design-to-code tooling, and adjacent analytics products. That breadth may suit a mixed enterprise estate. A team needing one simple table has a smaller shopping list. Grid Lite, an MIT-licensed Infragistics project, is itself a free option for basic grid needs.
05A lab with permission to miss
In June 2021, Infragistics announced a $50 million Innovation Fund and Lab. The crucial word is internal. The announcement described capital for employees to experiment beyond the core UI/UX business without an immediate requirement to produce revenue. It formalized a separation between existing earners and ideas still looking for a market.
The lab’s process included prototypes, testing, and internal and external reviews before projects received experimental capital to move toward market. The amount was a declared allocation, not a published account of money already spent. Calling it an outside funding round would give readers the wrong company.
The people policy matches that aspiration on paper. Its careers materials describe flexible work and, in some locations, open paid time off. Its published practices emphasize craftsmanship, direct communication, and measurement. These are the employer’s statements; the interesting test is whether a promising prototype can be stopped without turning its maker into a cautionary tale.
06Give the AI the catalogue
The June 2026 Ultimate 26.1 release moves the company’s component knowledge into AI development workflows. Agent Skills and Model Context Protocol servers supply documentation, API references, and theming context across Angular, React, Web Components, and Blazor. The purpose is practical: keep a coding assistant working with the library the team actually chose.
There is an old Infragistics problem hiding inside the new vocabulary. Developers need usable parts and a reliable way to assemble them. AI changes the assembly process, but someone still has to know which imports, components, and design tokens are correct.
- 01AskDeveloper intent
- 02GroundAPIs + design context
- 03AssembleLibrary components
- 04ReviewTeam checks output
A conceptual workflow, not a speed benchmark.
07Buy the repeatable work; keep the judgement
The useful thing to copy is the habit of identifying repetition before adding people. Try the awkward grid, the live chart, or the design handoff on a real screen. Include the hard data and the inconvenient interaction. Compare the saved work with licensing, integration, and maintenance. A persuasive demo should survive your own application’s peculiarities.
This approach has limits. A component library still needs application logic, data permissions, and testing. Generated interfaces still need review. An unusual interaction may demand custom work, and a project using a different stack may gain little from a broad bundle. Buying every tool in the catalogue is an expensive way to avoid deciding what you need.
Infragistics is most interesting when the problem looks too ordinary to deserve attention. The row, the cell, the chart marker: familiar objects with a backlog of difficult decisions behind them. Buying those decisions can leave a team more time for the part of its software that belongs to it.