A bank knows exactly how much money it has. The awkward question is how one change might travel through all the other numbers. A deposit leaves. A counterparty is tied to a borrower. A branch needs a fresh forecast. Somewhere in that chain, a risk manager asks for the path, not another stack of rows. That is the sort of question Ultipa was built to answer.
- Ultipa sells graph database and analytics tools, with banking as a prominent proving ground.
- China Merchants Bank says its asset-liability graph system saved 31,200 work hours; Ultipa says its engine powers the system.
- The product line now runs from a free noncommercial GQLDB edition to usage-priced cloud and custom enterprise deployments.
The company, founded in 2019 and based in Pleasanton, California, belongs to an unfashionable but necessary branch of enterprise software: the machinery that lets other people ask better questions. Its central product stores entities and relationships as a graph. People, accounts, transactions, suppliers and loans become nodes connected by edges. A query can then follow a chain of relationships, inspect its shape and return the route it took. This matters when the answer depends on the connections rather than any single record.
The balance sheet as a network
Ultipa's clearest named customer is China Merchants Bank. The bank disclosed an asset-liability management graph system in its 2023 interim reporting. Its account of the project described billions of detailed data points and said branch staff saved 31,200 work hours through deeper data mining and analysis. It also reported that a deposit forecasting model reduced manual forecasting errors by 70% and saved about CNY 1 billion in funding costs during that reporting period. Ultipa identifies its graph engine as the system underneath the project.
Those figures describe a bank's broader system, not a controlled experiment that isolates one database. Still, the application is unusually concrete. Asset-liability managers need to connect indicators that live in separate systems, test the effect of a change and account for the result. Ultipa's pitch is that a graph makes those cross-system paths available fast enough to use in a live decision.
There is a seduction in a benchmark: one machine runs a query in fractions of a second, another takes hours, and the argument appears settled. Bloor Research's Ultipa profile quotes a Shenzhen Stock Exchange comparison of a 32-layer investment-network query, with 0.2 seconds reported for Ultipa and two hours for Neo4j. It is an arresting example, but any buyer would need to reproduce it on their own graph, hardware and query semantics. The more durable question is whether the result arrives with an intelligible trail.
“With great efficiency and white-box interpretability, Ultipa's solution has been playing a key role for us...”China Merchants Bank, as quoted in Bloor Research's Ultipa profile
Where the lines become the answer
Ultipa's public hospital tutorial offers a humbler way to see the idea. It begins with familiar tables for doctors, patients, beds and departments, then asks which items are things and which are relationships. Once modeled, the screen shows patients linked to their doctors, wards and conditions. The illustration is a tutorial, not a hospital deployment, but it makes the advantage plain: an analyst can point to the route that produced a result.
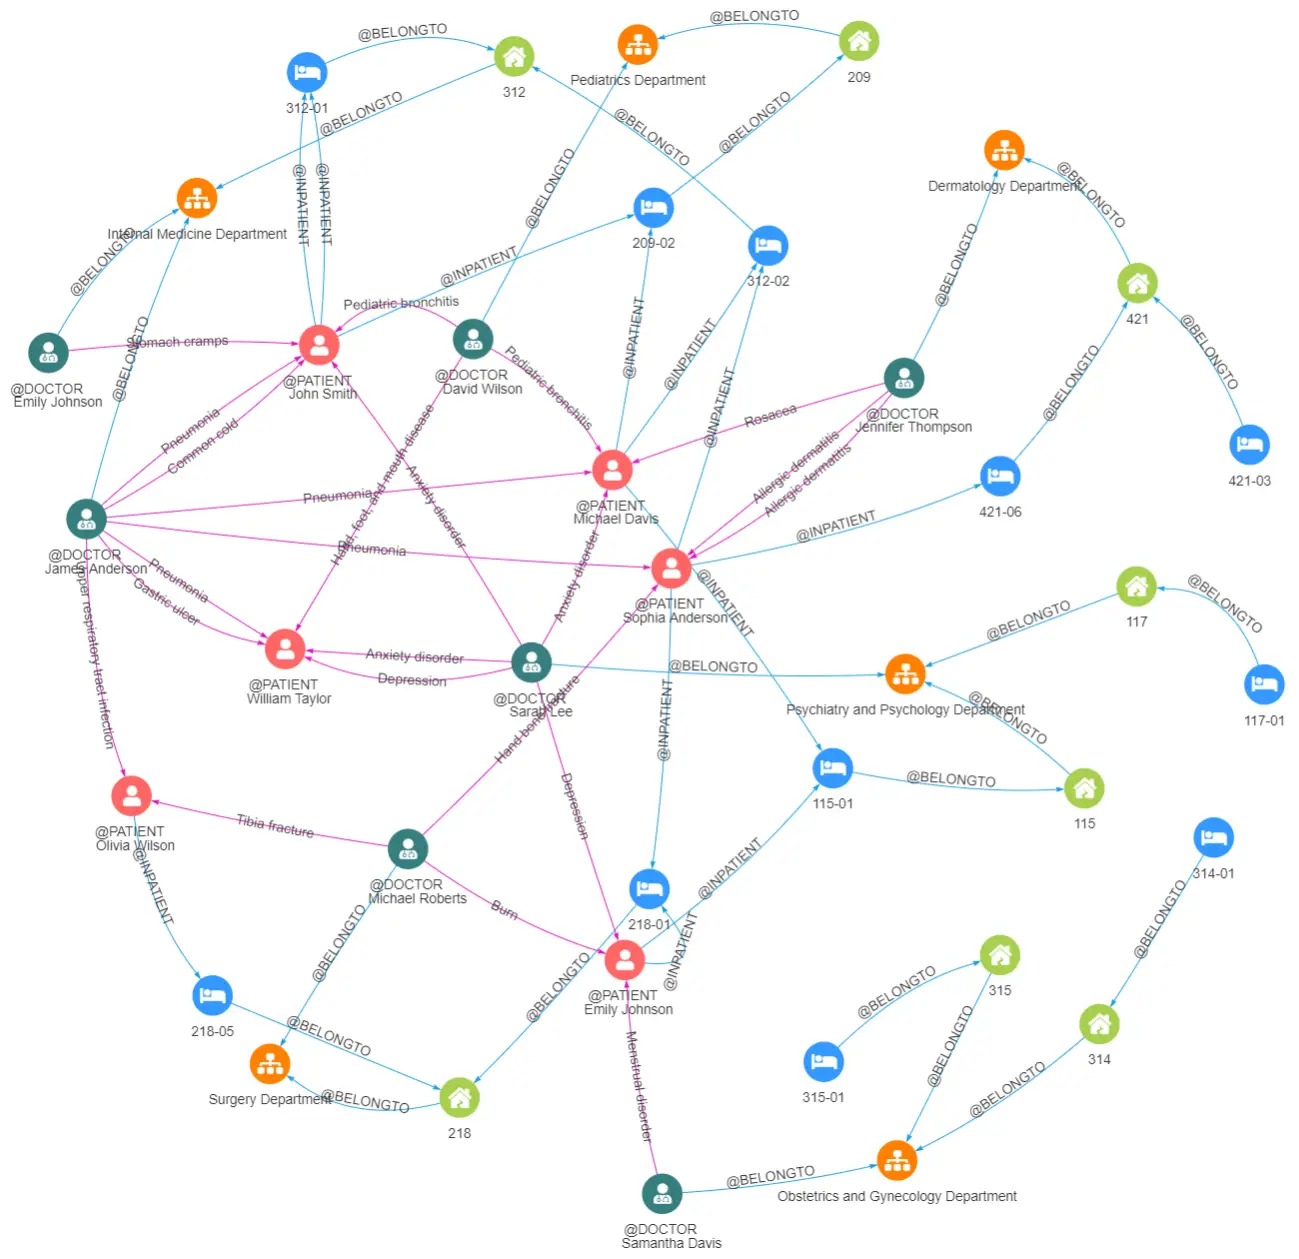
The same structure suits a fraud ring. One payment can look ordinary; the shared device, account owner, address and downstream recipient may be less innocent together. A supply-chain planner might follow a supplier through components and sites. A security team might trace a compromised credential toward systems it can reach. Ultipa also presents graph paths as a way to make AI output more inspectable: show the relationships behind a recommendation instead of asking a user to accept a black box.
A database, a language, a shop window
The product catalog has grown beyond the original Ultipa Graph database. Ultipa Manager gives teams a visual place to query and inspect graph data; Transporter handles import and export; the managed Cloud service sells hosted instances. Documentation now describes GQLDB as Ultipa Graph version 6, with graph algorithms, vector features and machine-learning functions. GQLDB Community Edition is free for personal and noncommercial use, a way for a developer to try the model before involving procurement.
There is also a language bet. ISO published the GQL graph query standard in 2024, and Ultipa documents support for nearly all of its features. A shared query language does not erase switching costs - data models and operational behavior still matter - but it makes a graph product less alien to a database team. That is commercially useful for a vendor trying to enter a market where Neo4j is the best-known name and TigerGraph, ArangoDB and others offer alternative routes.
The pricing tells a second story. Ultipa Cloud advertises a 14-day free trial, a Standard plan starting at $0.31 per hour and custom enterprise pricing. Its cloud terms describe prepaid, usage-based charges for compute, storage and outbound transfer. For an experiment, the entry cost is visible. For a production graph, the real bill includes modeling, data preparation, security review, monitoring and the staff time to prove that a new query actually changes a decision.
The narrow path to a broader market
Founder and CEO Ricky Sun has kept the company's vocabulary close to high performance and explainability. Ultipa says its engine combines transactional work with analytics, a useful pairing when a new event should affect the graph promptly. In 2025 it announced a partnership with IBA Group to bring its database and XAI tools into broader client projects. An earlier announcement named Anchora as a partner in Australia and New Zealand and described a live project at an unnamed EMEA revenue service agency. The reported footprint is wider than banking, though the best documented case remains financial.
What failed first in this category is often the simple assumption that more data automatically yields a better answer. If every connection must be assembled through slow, awkward joins, the useful question may arrive after the decision. A graph can shorten that journey, but only when the relationships are worth the cost of modeling and maintaining them. A small, flat dataset with simple filters may never need this architecture. Neither will a team benefit much from a fast path if it cannot trust the source records.
That gives prospective users a practical experiment to copy. Pick one painful relationship question - a fraud chain, an exposure route, a dependency between suppliers. Build a small, representative graph. Record how long it takes to get a correct answer and whether the path makes sense to the person who must act on it. Then compare the full workflow, not a single query stopwatch. Ultipa's own banking story suggests that the prize is not speed in isolation. It is the moment when a question that used to require a tour of systems can be answered while there is still time to do something about it.