The tests passed. The numbers were wrong. Dori Wilson had seen this particular office comedy before: a data system gives itself a stamp of technical correctness, then a customer or colleague notices something absurd. An impossible growth spike. A billing discrepancy. A security warning that should never have appeared. The machinery has done what it was told. Unfortunately, someone told it the wrong thing.
Wilson wrote about those failures in August 2025, explaining why she had joined Recce, a company building data-validation tools. Her account included a database refactor that left people checking tables by hand and adjusting filters in customer applications. Automation was present. Confidence had apparently stepped out. Her proposed remedy put human attention where a mistake would hurt most.
It is a revealing place to begin with a founder who once tried to improve presentations. Her career keeps moving between the system that produces a number and the person expected to believe it. A slide, a test, a conversation: each can carry information. Each can also conceal a misunderstanding very efficiently.
The analyst who built the presentation tool
Before Thorntale, Wilson analyzed and presented data at the Federal Reserve Bank of San Francisco, Uber, CircleCI, Mux, and Pave. At Mux and Pave, she was hired to build product analytics functions. That meant working with the expectations of established data organizations while helping smaller companies develop their own habits.
Thorntale brought her together with Ellen Hui and John Stimac. Hui's experience included Microsoft, Cruise, and Mux; Stimac had worked on big data at Yelp and built the data platform at Clockwise. The three founders entered Y Combinator's Winter 2024 batch. Their launch put data connections, charts, and collaborative presentation work in the same product. Wilson became its co-founder and founding CEO.
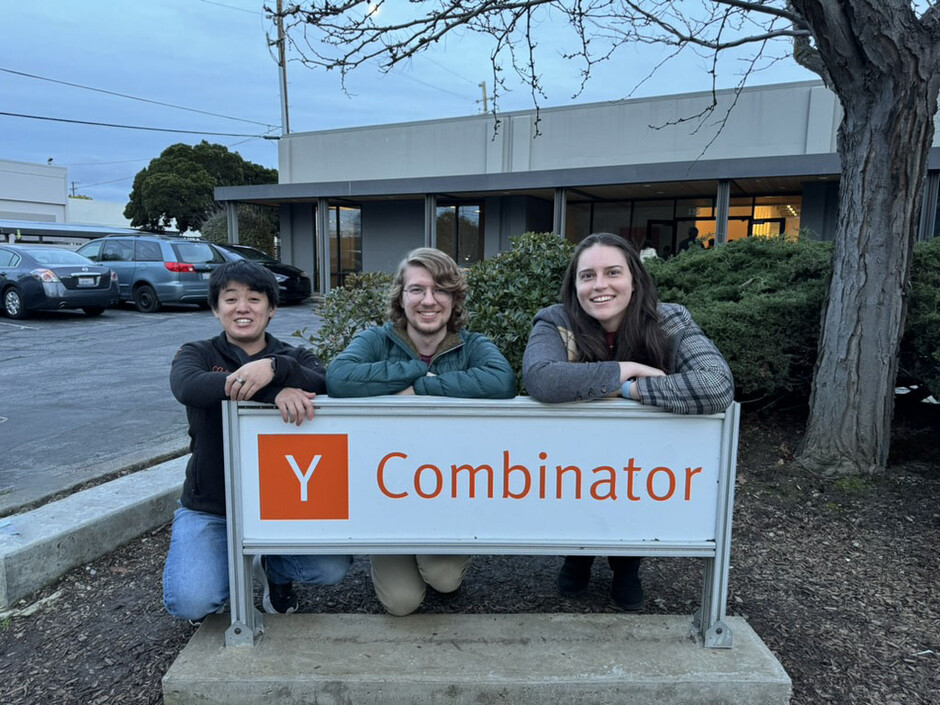
The premise was easy to recognize if you had ever carried a chart from one application to another and hoped nobody asked a follow-up question. A presentation is where an analysis acquires an audience. It is also where a living dataset can become a picture of its former self. Thorntale was an attempt to keep more of the original work alive in the telling.
A question the chart could not answer
Wilson later described a less tidy origin. After a layoff, she assembled friends and used a YC application to organize their thinking. They initially proposed a business-intelligence tool. Once accepted, a conversation with Michael Seibel sent them back to examine where decisions actually happened. They landed on presentations.
What followed changed her view of the problem. Customer interviews challenged her belief that better tools would necessarily improve communication. The way someone framed a question mattered enormously. Thorntale did not work out; YC now lists it as inactive. Wilson's account gives the experience a useful ending: ask what an analysis will change before deciding how to display it.
“What will this change?”
Dori Wilson, discussing data storytelling
That question is short enough to survive a meeting. It asks an analyst to identify the consequence of being right. It also asks the recipient to admit what decision is really on the table. A beautiful chart can postpone that conversation by giving everyone something agreeable to admire. Wilson had built a company around the presentation. She came away paying closer attention to the question that precedes it.
When a customer visit means trouble
Her experience with infrastructure products gives this concern a practical edge. In a talk called Where product analytics fails: Measuring invisible products, she described work at CircleCI and Mux where a customer opening the interface could mean something had gone wrong. The product was supposed to work quietly inside another workflow.
For that kind of business, counting clicks can reward the very thing the customer would prefer to avoid. Wilson's talk instead examines API activity, job runs, asset flows, and patterns at the organization level. The unit of attention changes because the product's job changes. An analyst has to understand that job before choosing a measure.
For infrastructure products, Wilson looks beyond clicks to system activity and organization-level adoption.
It is the sort of observation that sounds obvious immediately after someone says it. Before that, an entire dashboard can be devoted to the wrong behavior. This is where her work becomes interesting as a portrait of judgment: the familiar measurement is available, the unfamiliar question is necessary, and somebody has to resist choosing the convenient one.
The small tyranny of three minutes
There is another Wilson, visible in her technical writing, who is concerned with a date table. In June 2025, she documented a seed file containing 55,152 rows that added roughly three minutes to each dbt build. The table supplied calendar dates. Reloading it repeatedly was an expensive way to be reminded that Tuesday still followed Monday.
Her solution was to preserve the logic in a macro and generate the table when needed. It was a small change, explained so other teams could use it. The value came from repetition: a nuisance attached to every build gets plenty of opportunities to waste time.
This is an unglamorous detail to keep in a founder's story, which is precisely why it belongs. There are public conversations about the future of data. There are also slow builds on an ordinary workday. Wilson writes about both. The smaller example shows a willingness to explain a fix without pretending it requires a philosophy, an off-site, or a new department.
The assistant that forgot what it knew
By February 2026, she was experimenting with AI-assisted warehouse work at Recce. Production data moved through S3 into Snowflake, with dbt models on top. She gave Claude Code existing conventions and examples, then let it attempt a substantial stretch of the work. Some results followed the intended patterns; others revealed how much an assistant could miss while producing plausible code.
It overlooked an existing date table and recreated date logic. It also used inner joins that could quietly discard rows. Those are consequential decisions disguised as implementation details. Her response was to correct the work and make the lesson persist in the project's instructions.
A March guide carries the experiment further. She describes a cycle of writing code, reviewing it, recording decisions, and updating reusable instructions. One example concerns weekly distinct users: taking the maximum daily count cannot tell you how many different people appeared over the whole week. The arithmetic can look respectable while answering the wrong question.
- BuildUse project context
- ReviewCheck meaning and logic
- RecordKeep the reason
- UpdateImprove the next run
Her working system captures the correction in places future sessions will consult. That makes institutional memory a practical engineering concern. Someone has already paid to discover why the numbers were wrong. Writing down the reason gives that expense a chance to be useful twice.
The podcast began with someone else's good idea
Her interest in persistent context also grew through podcast production. A colleague, Karen, had begun using a content repository for editing. A marketing consultant and mentor, Jenneviere, developed a sequence of prompts for turning transcripts into material for different platforms. Wilson saw an opportunity to connect those steps and preserve what the team learned.
She reports reducing that production workflow from a full day to about two hours, including clips, scheduling, posting, and editing. The account gives credit to the people whose work preceded hers. It also captures her method: notice a useful practice nearby, combine it with another one, then write down how the combination works.
Conversation is an ongoing part of her work. She co-hosts Data Renegades with Recce founder CL Kao. The show has featured Simon Willison, Maxime Beauchemin, Benn Stancil, and Wes McKinney, among others. Its appeal lies in asking builders how their tools came to exist, including the mistakes and changes of direction that a polished product announcement tends to leave outside.
Willison, for example, wrote about his appearance and the discussion of data journalism. Wilson and Kao's guest list moves between software, organizations, and the people making decisions inside them. She also co-hosts Chats with My Tech Friends with Natasha Golubev. On her own site, she describes agreeing to start a podcast with a brisk “okay, let's go.” Some projects evidently begin with less paperwork than a data migration.
Thirty-one people and some fries
Data Debug SF, the monthly gathering Wilson runs, supplies a more local version of that exchange. Her February 17, 2026 recap records 110 RSVPs, 31 attendees, and eight returning participants. Before the talks, five people spent time with her in Heavybit's basement, computers out, EDM playing, sharing Souvla fries.
She compared it to a college study session. The detail is more informative than a claim about networking: people arrived early enough to sit at a long table and work alongside one another. That was the evening she felt a solid community taking shape.
The talks ranged from open-source integration to Duck Lake and context graphs. Wilson wrote the recap partly to absorb ideas herself, and she linked recordings so the discussion could travel beyond the room. Here the person who spends her working life questioning measurements supplies several of her own. The returning faces seem to matter at least as much as the registration total.
The question travels with her
More recent event materials identify Wilson as a senior data scientist at Chime, speaking about analytics agents alongside practitioners from LinkedIn, Salesforce, and Adobe. The setting has changed again. The questions remain close to the ones she has been testing across startups, writing, podcasts, and meetups.
Who understands the definition? What disappears in the handoff? Where should a person intervene? Her economics background, work in product analytics, and experience founding Thorntale give those questions different settings rather than a single neat answer.
A useful number has to survive more than a query. It has to survive being explained, questioned, reused, and acted on. Wilson keeps working along that route. Sometimes the task is a presentation. Sometimes it is a join that quietly drops rows. Sometimes it is getting people into the same room, with enough time left over for fries.
Keep following the conversation
Dori's website · Personal writing · LinkedIn · X · Bluesky · Instagram · Threads · GitHub
Listen to Data Renegades
Chats with My Tech Friends
Watch: Look Before You Merge
Podcast videos on YouTube
Find Data Debug SF events
Thorntale's YC profile and launch
Wilson's talk on invisible products
The date-table fix
Her essay on passing tests and wrong data
Her guide to AI skills for analytics
Persistent context for AI tools
The February meetup dispatch