The most dangerous number in a growing company may be the one everybody thinks they agree on. Ask People how many jobs are open. Ask Finance what those jobs will cost. Ask Recruiting which are approved. Three perfectly competent teams can produce three perfectly plausible answers. The difference may be only a few rows in a spreadsheet. It may also be a quarter's hiring budget.
ChartHop was founded by Ian White in 2018 to close that gap. White had co-founded the email software company Sailthru, where he learned that the software for serving customers was often clearer than the software for understanding his own staff. His first answer was almost comically modest: an org chart that updated itself. The larger answer emerged as the chart began to carry more information - who reports to whom, which roles are planned, what they cost, and what happened since the last plan.
- ChartHop joins employee and business data into a current model of the organization.
- HR, Finance and managers use it for hiring plans, pay cycles, reviews, engagement and goals.
- Its public price starts at $5 per employee per month for Core, with modules added separately.
- Its best argument is the avoided handoff: fewer copies of the same plan, each claiming to be final.
The chart that refused to sit still
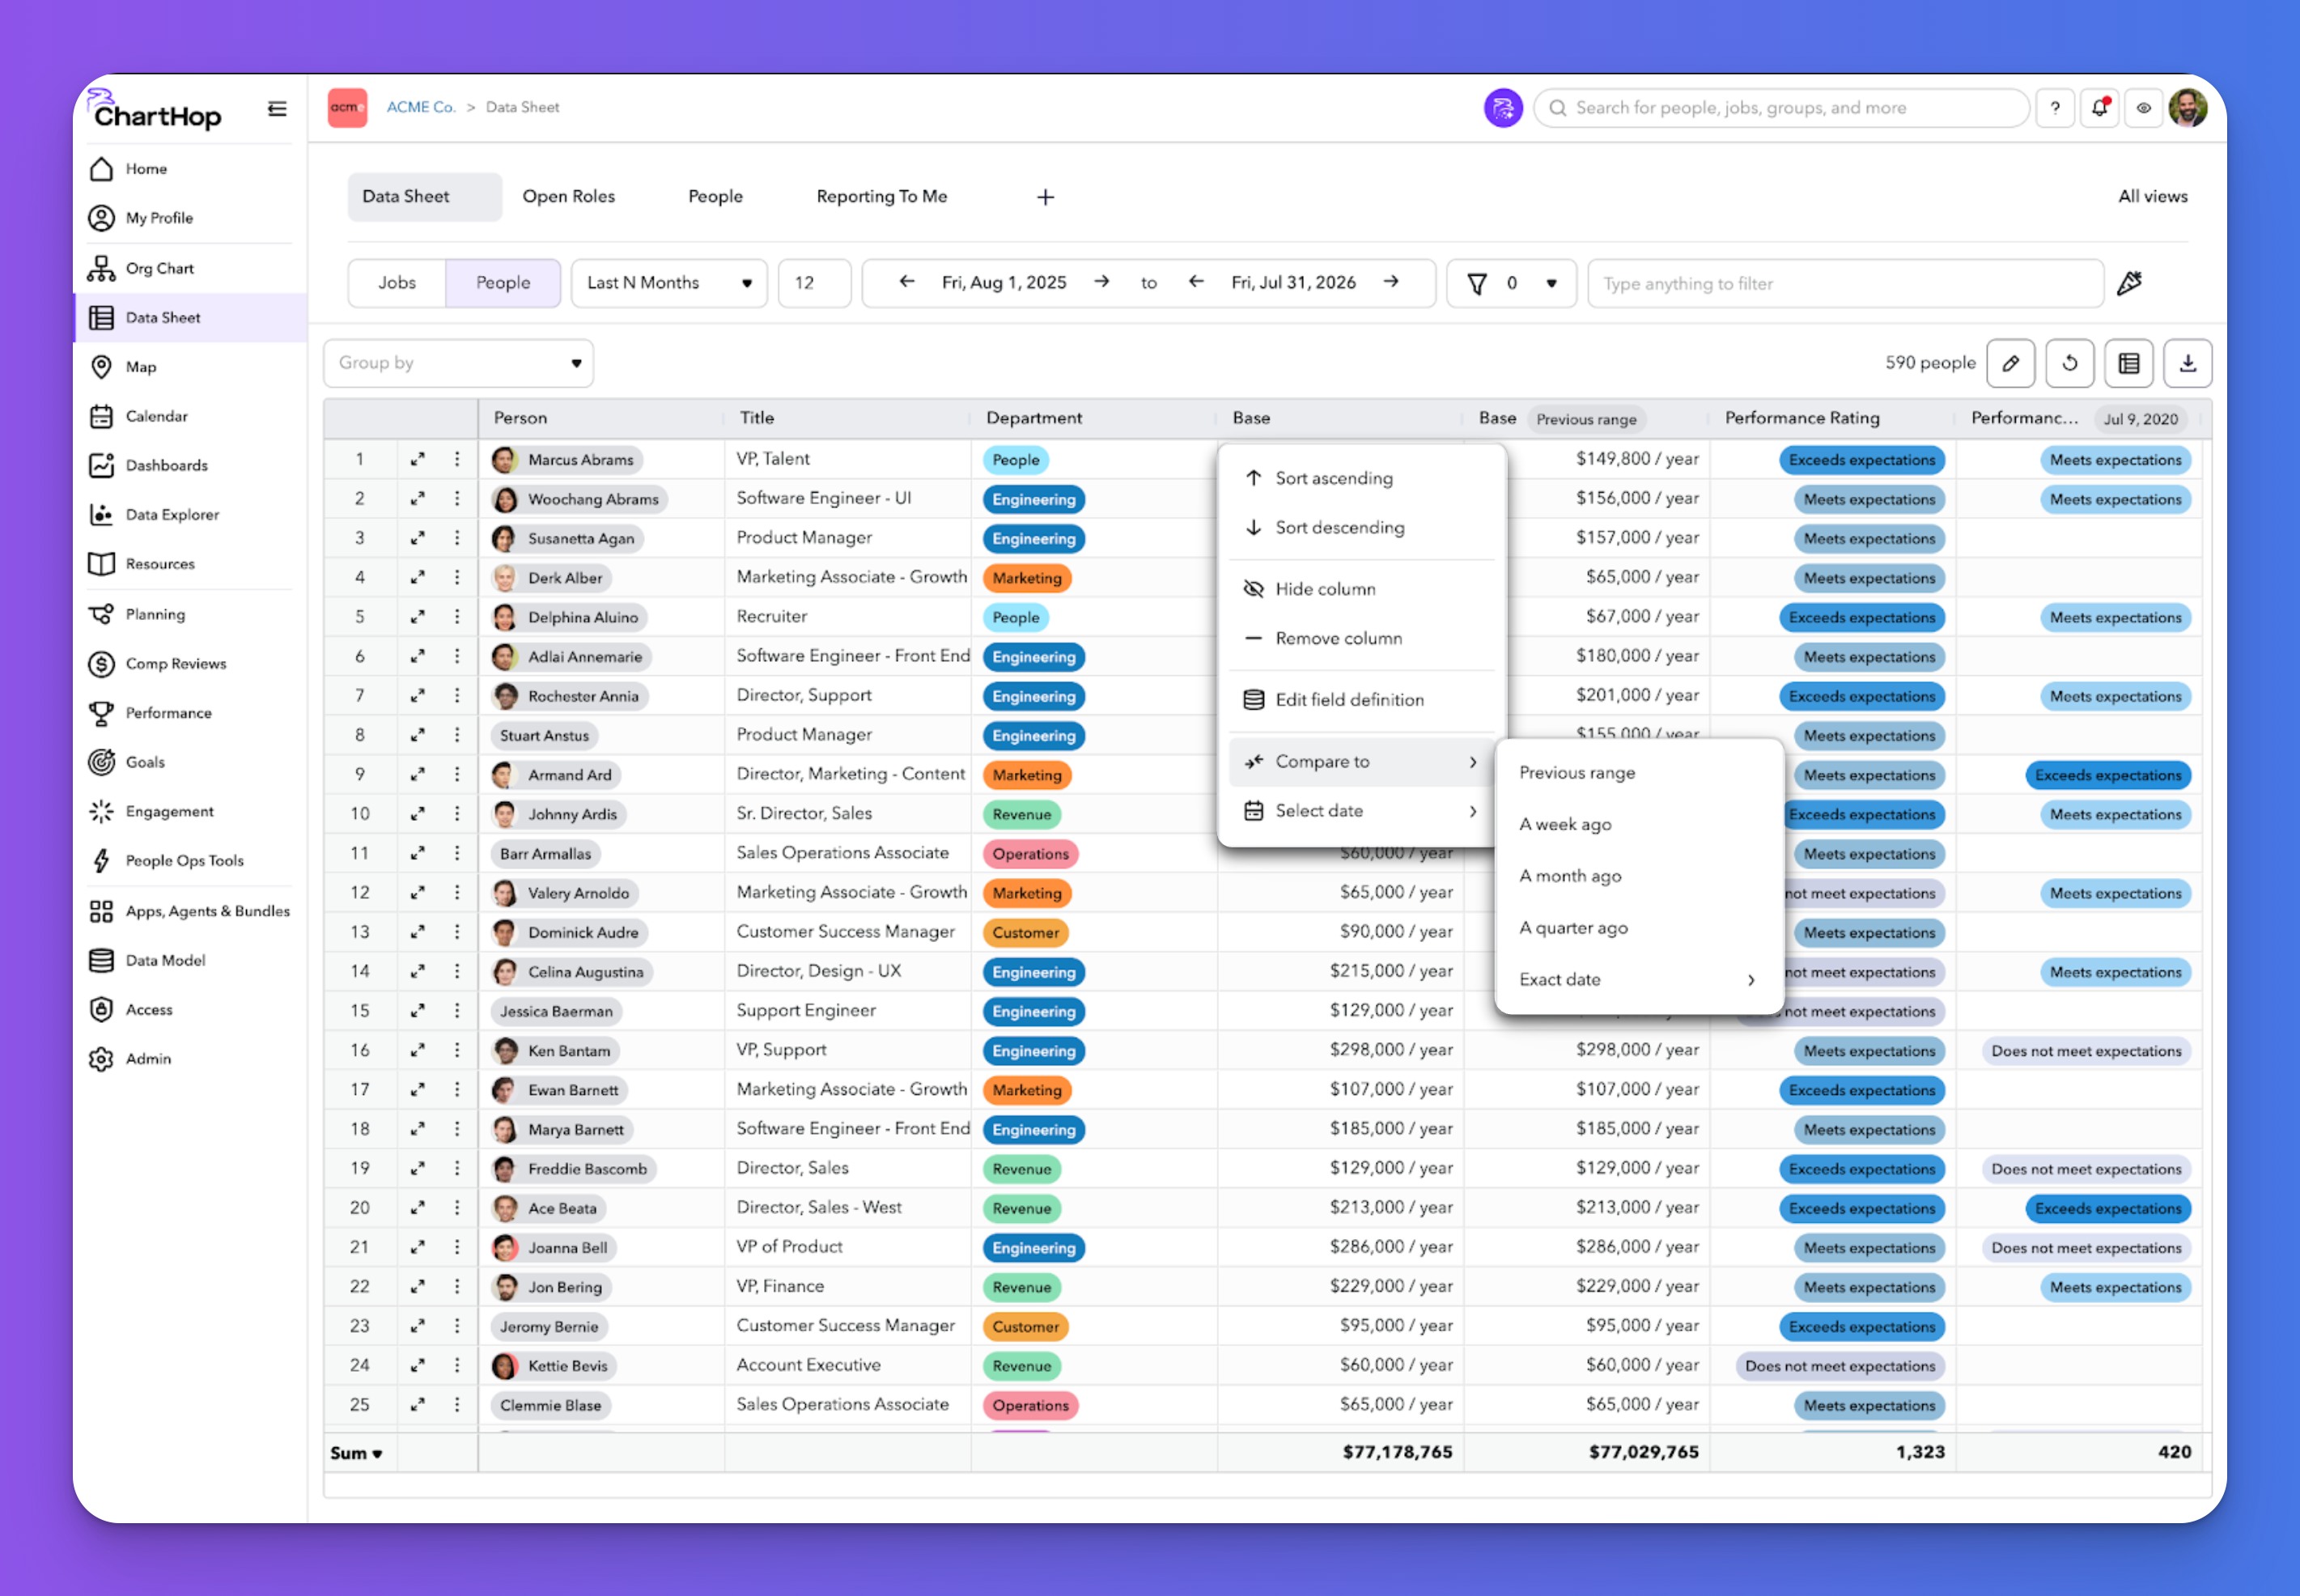
A conventional org chart is a souvenir of an organization. It freezes a moment that has already passed. Someone changes teams; a role opens; a manager inherits three reports. The diagram waits for an administrator with spare time. ChartHop made the diagram a view of connected data, with employee profiles, maps, dashboards and a data sheet around it. Its integrations pull from existing HR, recruiting and finance systems, while its own HRIS can serve teams that want one.
That distinction matters because most companies do not begin with a blank stack. They already have payroll, an applicant tracker, perhaps a planning tool, and enough spreadsheet tabs to suggest a small library. ChartHop can sit over those systems as a visual and planning layer. The company says it connects with more than 100 tools, including ADP, Greenhouse and Workday. It also sells workflows that let a company move from observing its structure to changing it.
The useful trick is to keep a proposed future separate from the present. A manager can sketch an extra team without quietly turning a possible hire into an approved one. Finance can see the cost basis. Recruiting can see what has actually cleared the gate. It is a mundane distinction, and precisely the sort that breaks when everyone owns a different file.
A hiring plan is a group project
Wistia provides a useful test. Before adopting ChartHop, its People team circulated separate spreadsheets for department heads, normalized fields by hand, and assembled a master plan. Finance, looking at a moving target, used estimated salaries and placeholder start dates to forecast. Wistia says ChartHop gave those parties a shared view of anticipated starts, recruiters and hiring managers. Once a job is approved, a direct sync pushes consistent details into its applicant tracking system.
hours per week Wistia says its People team reclaimed by removing manual data pulls, report building and spreadsheet consolidation. This is a customer-reported result, not a universal promise.
The first thing that failed was not strategy. It was version control. The company did not need a more eloquent spreadsheet; it needed the approved role and the recruited role to be the same role. That is a lesson a reader can copy without buying anything: name one owner for the hiring plan, give each proposed job a stable identity, and make the approval state visible to everyone who must act on it. The tool becomes valuable when it keeps those agreements current automatically.
Plaid describes a similar shift from spreadsheets and email to shared headcount scenarios. 1Password brought a more delicate problem: compensation planning. Its People team had kept sensitive pay information across multiple sheets and drives. In ChartHop, it consolidated the review process with role-based access. The point is not maximum transparency. A salary history must be visible to the right person and invisible to the wrong one. In this business, permissions are part of the product, not a setting to revisit later.
“When we switched on ChartHop for the whole organization, suddenly everyone could see our hiring plan.”Taylor Roa / Wistia
The $5 question
ChartHop charges by employee, per month, billed annually. Its published Core tier is $5 per employee per month and includes the org chart, analytics, profiles, dashboards and AI insights. The company then sells additional modules. HRIS, headcount planning, compensation and performance each list at $4 more per employee per month; engagement and goals each list at $3. AI Pro uses pay-as-you-go pricing. Volume and enterprise deals may differ.
For a 500-person company, Core and headcount planning at those list prices would come to $4,500 a month, or $54,000 a year before any negotiated terms. That is real money. It also frames the question properly: how much time is spent reconciling headcount, how often does a wrong start date distort a forecast, and what is the cost of a compensation file in the wrong hands? Buyers should measure those problems before declaring a platform either cheap or expensive.
The alternatives are varied: keep the existing HRIS and improve reporting, use specialist tools for reviews and surveys, buy dedicated FP&A software, or keep working in spreadsheets. ChartHop's wager is that people decisions lose context when those jobs are isolated. The wager is weaker when a company has clean, shared data already, few organizational changes, or no appetite to maintain another integration. A living picture only helps if its inputs are trustworthy.
The org chart learns to answer back
The company has been widening the picture for years. It announced a $5 million seed and a $14 million Series A in 2020, a $35 million Series B in 2021, and a $20 million Series C led by Cox Enterprises in 2023. White said at the Series C announcement that revenue and active users had each quadrupled since the previous round; those are company-reported growth figures from that period. In 2024 ChartHop introduced its own HRIS, a notable change for a product that had long emphasized connecting existing systems.
In 2026 it added Goals, whose progress can be tied to live business signals, and AI Pro, whose configurable agents can answer questions and act across connected tools. Its June release described agents in Slack and Teams, permission-scoped connections and approval controls. A September update added comparisons against historical dates, automatic time-off awards and translated goals. The original org chart has become a time machine, a workflow engine and, cautiously, a conversational interface.
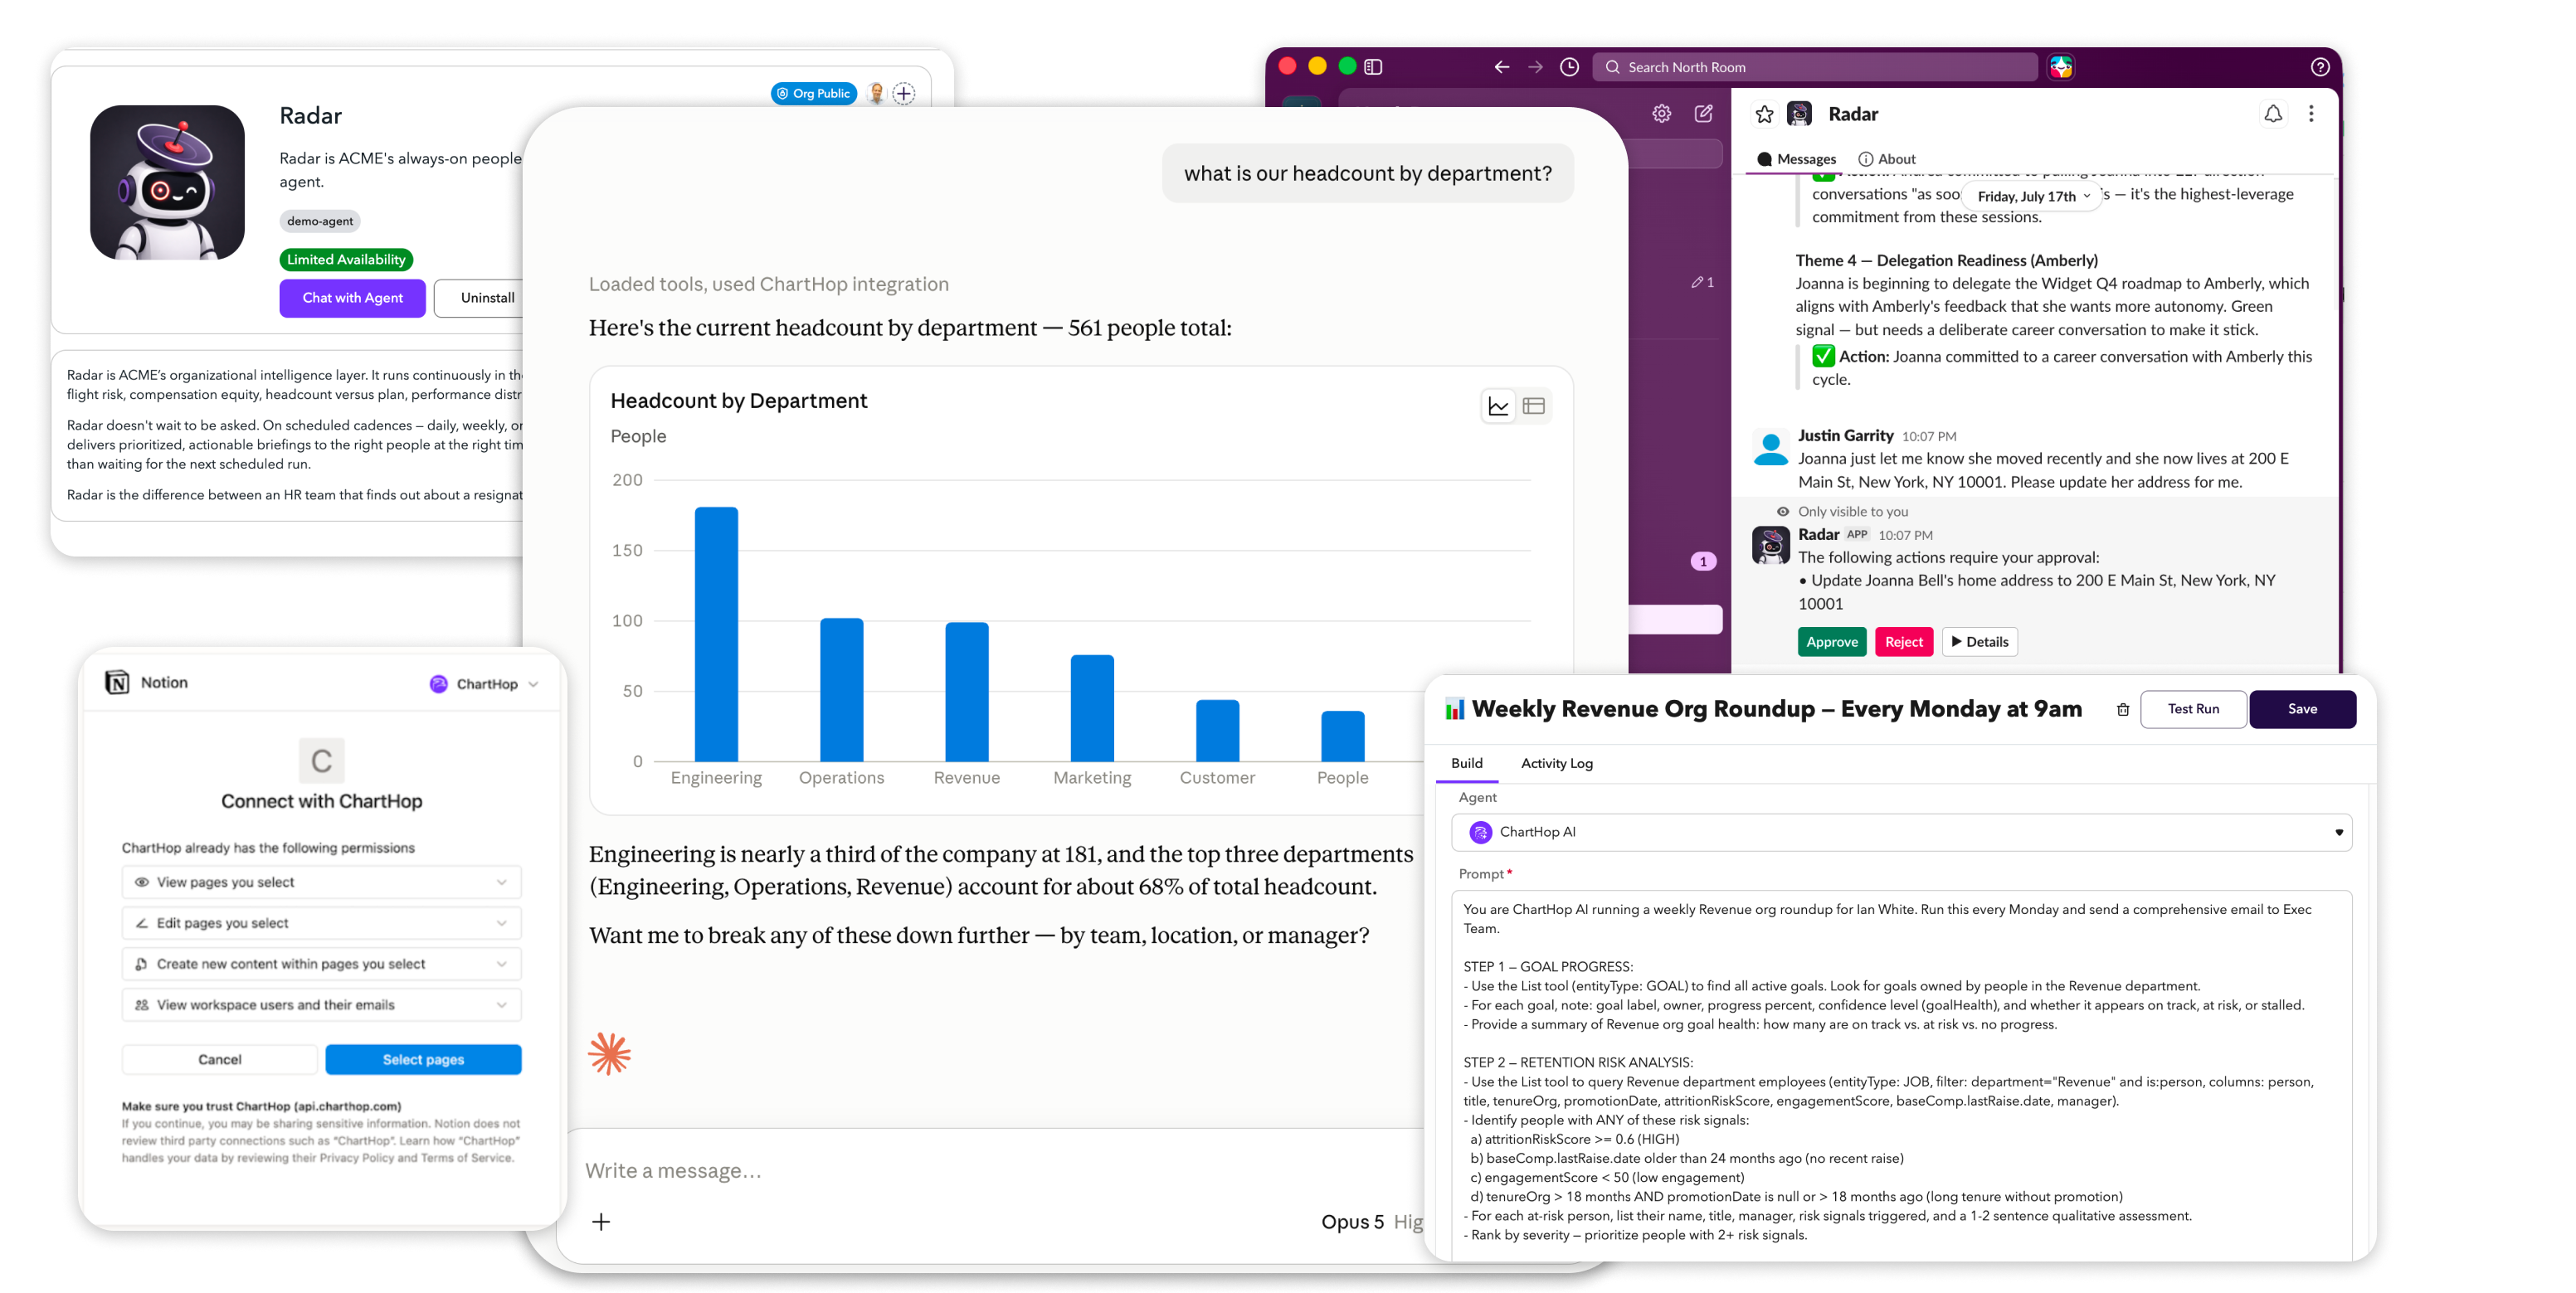
This expansion brings a new obligation. It is one thing for an inaccurate field to spoil a dashboard; it is another for an automated workflow to act on it. ChartHop says its AI actions remain inside existing access controls and show a summary for approval before changes are made. The strongest use of such a system may be less theatrical than an autonomous agent: a manager asks what a proposed hire does to next quarter's budget, gets an answer from current data, and knows exactly who must sign off.
White's original complaint was that he could not get a straight answer about his own organization. ChartHop's product story suggests the answer was never merely a prettier chart. It was a chain of custody for the facts behind the chart: where they came from, when they changed, who can see them, and who may turn a plan into reality. That sounds almost bureaucratic. Then again, so does paying the right people to do the right jobs on the right date. Growing companies tend to find it thrilling when those things finally agree.