In 2013, Costa Tsaousis had a remarkably modest requirement: complete a financial transaction within three seconds. His employer was moving from physical servers to cloud virtual machines. The business numbers showed missing volume and missed service targets; the operations screens, serene as a hotel lobby, showed healthy systems. That disagreement became the origin of Netdata.
The team had Zabbix, OpenTSDB on Hadoop and an Elastic stack for logs. Tsaousis says it tried commercial tools too. The monitoring bill eventually reached twice the hosting bill, yet brief stalls still went unexplained. Consultants reviewed applications and recommended refactoring. The stalls persisted. What finally changed his mind was the possibility that the problem lived in the monitoring method itself: sparse samples and central pipelines might be smoothing over the very seconds that mattered.
- What it does: Netdata monitors systems, containers, networks and applications with per-second metrics, alerts and automatically generated dashboards.
- What it sells: A free open-source Agent; paid Cloud and on-premise plans for fleet views, access controls and AI investigations.
- Who uses it: Sysadmins, SREs, DevOps and platform teams, from a few servers to large multi-node estates.
- The unusual bet: Keep metric values on the customer’s machines and send the code and queries to where the data lives.
The freezes inside the average
Tsaousis began writing a lightweight agent in C at home, after work. Its early design avoided disk access so thoroughly that the default retention was only an hour. The sacrifice was deliberate: a monitoring tool that made production slower would be a particularly expensive joke. Once installed on the company’s machines, the prototype exposed what the existing stack had missed: one-to-three-second freezes in guest VMs, arriving in bursts, along with storage throttling bugs and troubled network switches at the provider.
“We were spending twice as much as hosting, on monitoring.”Costa Tsaousis, recalling the original failure
The lesson is easy to copy, even without copying Netdata: if the customer notices a delay your chart cannot see, shorten the observation interval before adding another dashboard. A five-minute average can make a three-second stall look like nothing. A per-second trace gives the operator somewhere to start. It does not prove causation on its own, but it stops hiding the suspect.
A launch that went nowhere, until it did
Netdata entered GitHub on March 22, 2016. For several days, almost nobody came. Tsaousis wrote to Linux publications without much luck. Then, on March 30, he posted it to Reddit; someone else carried it to Hacker News. He returned from meetings to a crowded mailbox and a stream of GitHub issues. In his account, the project reached 10,000 stars in a couple of weeks. The boring first week is part of the story. The tool was useful before an audience appeared.
Those new users also changed what the software could become. Their bug reports, collectors and odd production setups turned a local fix into a general-purpose Agent. Netdata now describes more than 615 contributors. The company’s culture still rests on that public development process: engineers can inspect the GPLv3+ Agent, run it without the commercial service and contribute to it. The dashboard interface and Cloud layer have different licensing terms, a distinction worth understanding before a large deployment.
The machine does the collecting
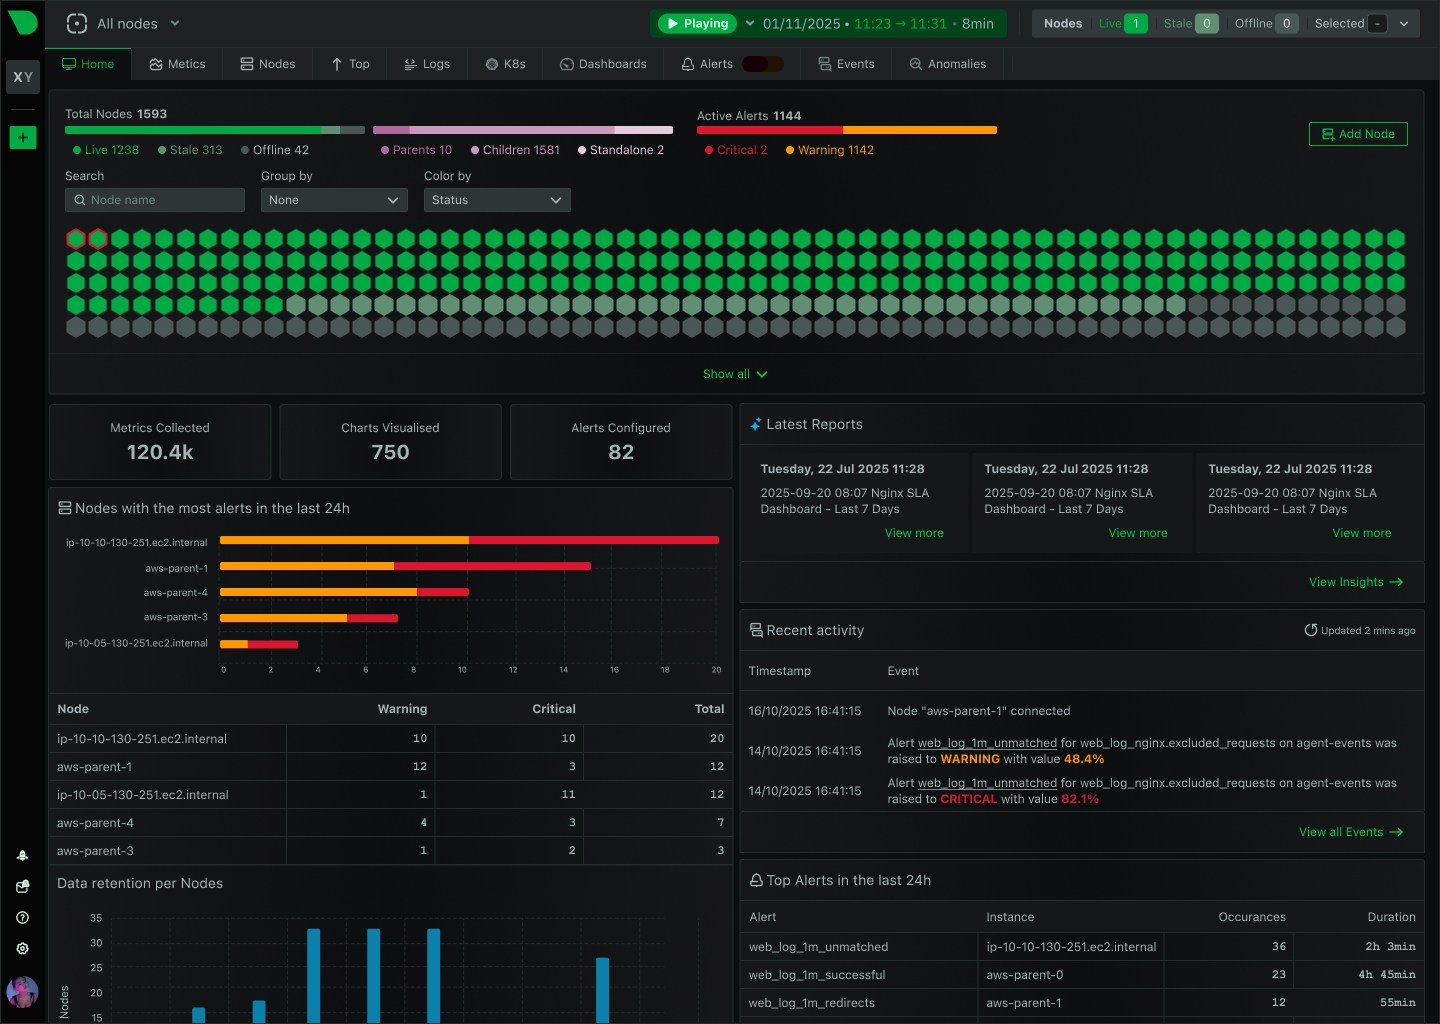
Netdata’s architecture is the point of difference. An Agent runs beside the workload and collects, stores and analyzes telemetry locally. It auto-discovers many common services and creates charts without asking an operator to design each one. Agents can feed a Parent for larger installations. Netdata Cloud supplies a shared view, permissions, alerts and remote queries across that fleet, while the company says metric and log values remain on customer infrastructure. The result is a different cost shape from tools that charge as every additional signal flows into central storage.
An operator can install an Agent, inspect CPU, memory, disk, network, containers and supported applications, then investigate a spike without first building a query language or a wall of charts. Kubernetes users can deploy through a Helm chart. Teams with existing tools can use Netdata’s integrations and export paths rather than replace everything at once. Those are practical choices, not magic: a collector still needs access to the thing it measures, and an AI diagnosis still deserves a human check before production changes.
The commercial line is clear. The open-source Agent is free. The current Community Cloud plan allows five active connected nodes; Business is advertised from $4.50 per active node per month when billed annually, with unlimited metric and log volume on that plan. AI work can consume separate credits. For one server, the local Agent may be sufficient. For a team managing hundreds, shared access and cross-node investigation become the purchase. Compared with a Prometheus-and-Grafana stack, Netdata emphasizes automatic discovery and ready-made troubleshooting. Compared with a centralized SaaS platform, it emphasizes local storage and a node-based bill. Neither comparison eliminates the need to test coverage and operational fit.
The customer who has no spare day
Netdata’s published customer stories span universities, manufacturers, lenders and municipal IT. Malmö stad offers the sharpest example. A team of two to five people runs digital services for a Swedish city of about 366,000 residents across development, test, staging and production. Its older monitoring could say whether a system was up. It was far less helpful when the system was slow. In one mission-critical incident, the city says Netdata AI read several gigabytes of logs, found multiple contributing issues and helped restore normal operation in under 30 minutes. The team estimates that job previously took a working day.
That is a customer report, not a universal performance promise. Its useful lesson is narrower: the more a team’s time is consumed by gathering evidence from separate places, the more valuable it is to make that evidence ready at the moment an alert fires. At KAUST, the Saudi research university, another published case study reports a 50% improvement in troubleshooting efficiency. Both examples fit Netdata’s stated audience: operators who have more systems than hours.
The metric still does not know the business
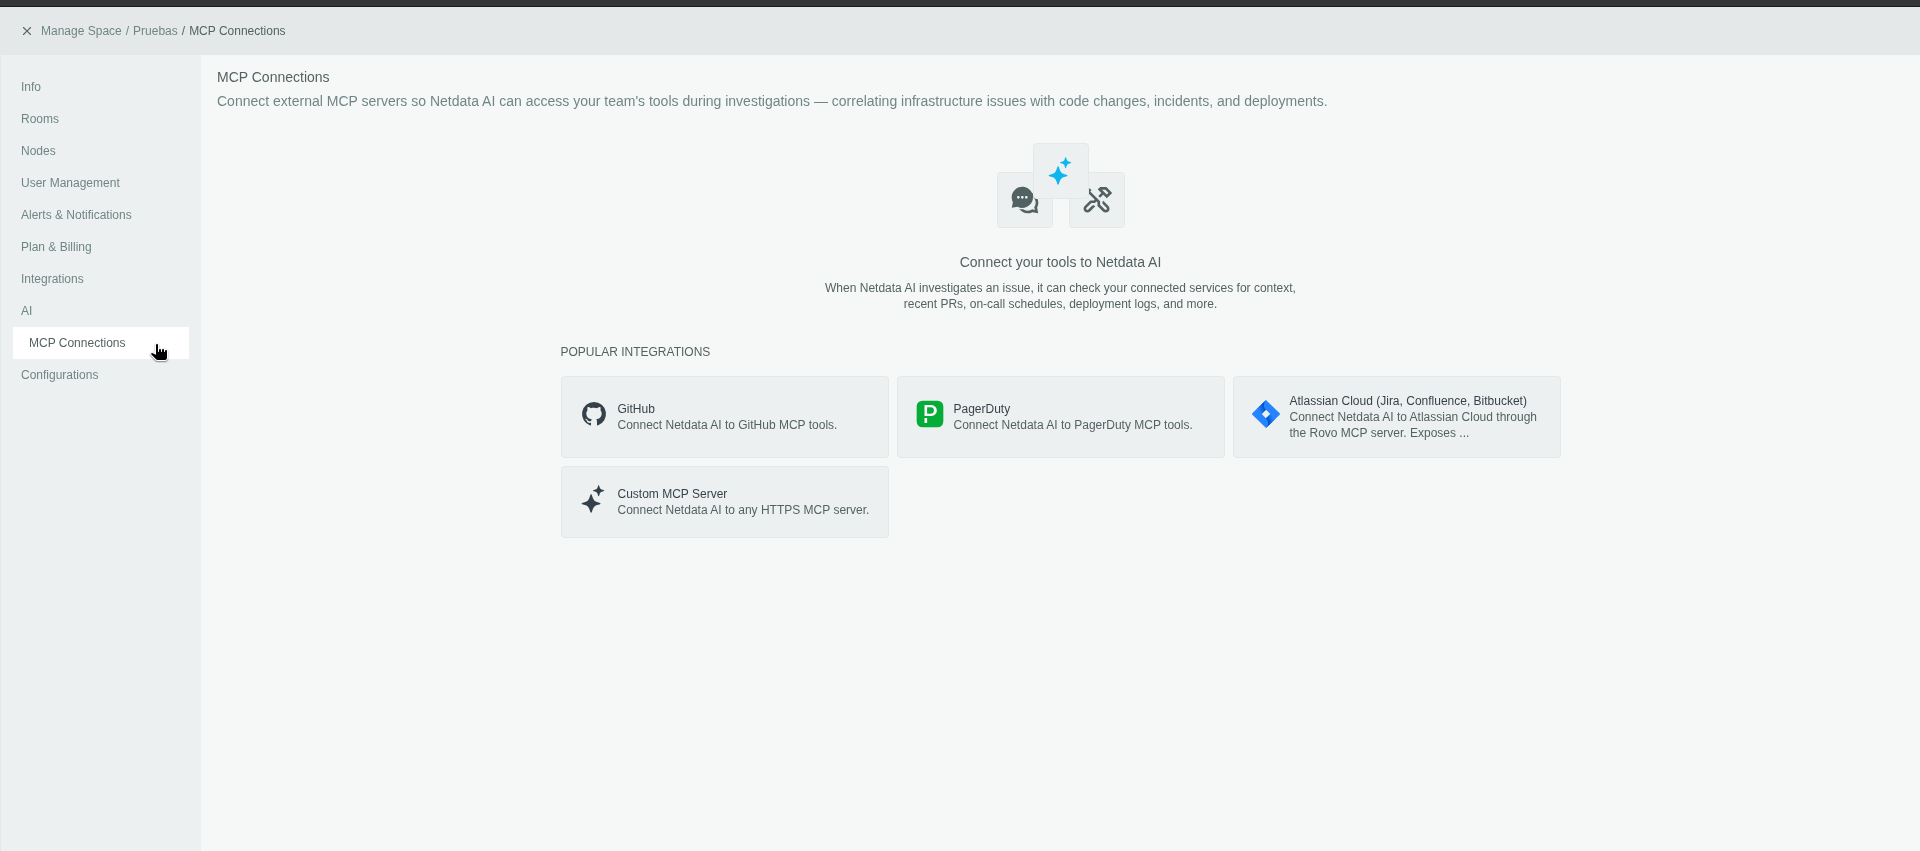
Netdata’s 2026 releases reveal an honest limit of telemetry. A CPU reading can tell you that a server ran hot; it cannot tell you that the server is a staging box, that Tuesday’s spike was expected, or who owns the service. Netdata added a Cloud MCP endpoint for AI clients to query a fleet, then MCP Connections to read context from GitHub, PagerDuty and Atlassian. In September it introduced Infrastructure Knowledge, a place for teams to record ownership, priorities and normal behavior so AI investigations have the human facts they need. That feature is on paid Cloud plans, and the external connections are read-only.
It is a revealing evolution. The company began by asking what happened in a missing second. It now asks what that second meant. The answer still depends on the same discipline that built the first Agent: collect enough detail to see the event, keep the system economical enough to leave it running, and give the person on call a way to act before the next transaction slips past three seconds.