IMPACTS / ICE / VOLCANISM
A very old world, a new way to read it
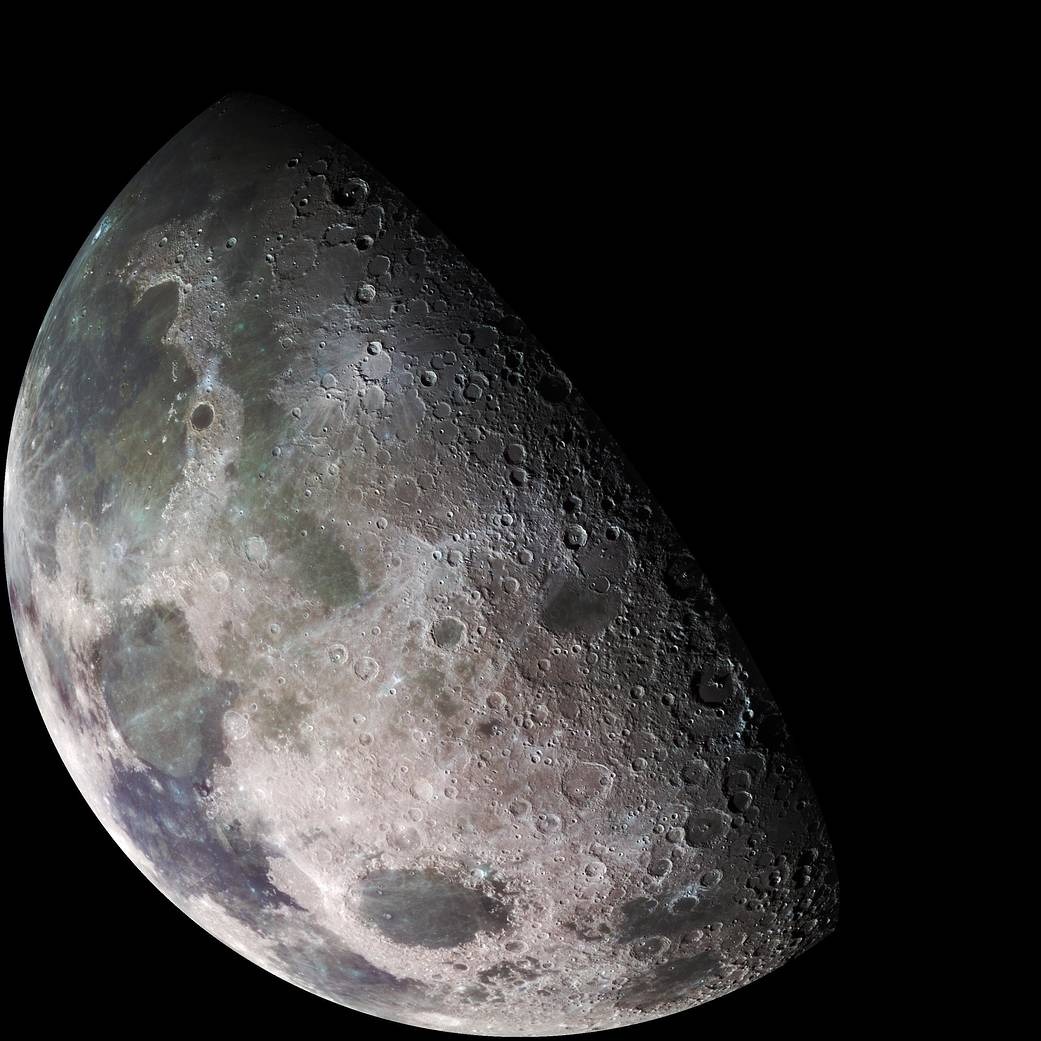
The Moon keeps its history in plain sight. An impact leaves a crater. Lava leaves a plain. Ice may survive where sunlight cannot reach. Reading those traces is another matter: the evidence arrives through different instruments, at different resolutions, in maps that were never designed to answer one question together. Even a world without weather can present an untidy archive.
On September 10, 2026, IBM and NASA released the NASA-IBM Lunar Foundation Model, one of the first publicly available foundation models built specifically for lunar science. Alongside it comes a unified dataset that gives researchers a way to connect observations previously scattered across missions. The ambition is to make the Moon’s scientific record easier to interrogate, from its shadowed poles to its ancient volcanic terrain.
For IBM, the release makes a particular argument about AI: expertise can be shared as a model, and the material needed to develop that expertise can be shared too. The interesting question is what a scientist can do with that starting point. Three early tests offer an answer.
First, put the evidence on the same map
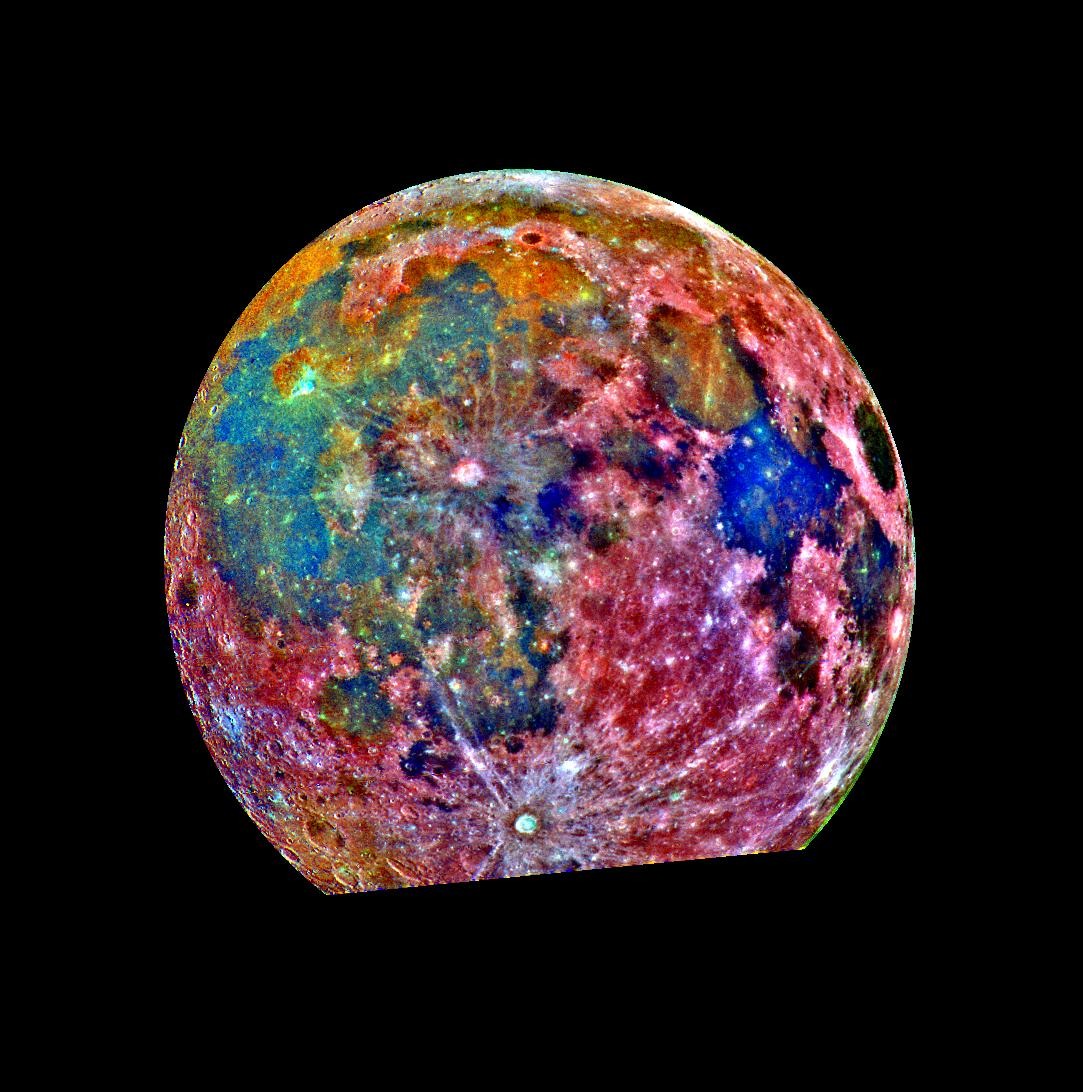
The dataset brings together more than 30 spatially aligned layers from nine instruments across four missions. It draws on NASA’s Lunar Reconnaissance Orbiter and GRAIL, Japan’s SELENE/Kaguya, and Lunar Prospector. Images sit beside measurements that describe different physical properties of the same terrain. A photograph supplies appearance; other observations contribute evidence that appearance alone cannot carry.
Spatial alignment is the essential housekeeping. Imagine several transparent maps laid over a desk. Unless their locations agree, a crater on one sheet might be compared with the wrong patch of ground on another. Align them and separate measurements become evidence about a shared place. The computer has something coherent to learn from.
A foundation model learns patterns across that collection before being adapted to a particular task. Researchers can then start with a trained representation of lunar terrain, rather than assemble an entirely new learning system for each investigation. That is the practical promise of this release: spend less effort rebuilding the desk, and more deciding which question deserves to be laid upon it.
RMSE versus SwinV2-B. Predicting ice potential, rather than measuring recovered ice.
AP@75 versus SwinV2-B in the half-training-data comparison, at ~100 m/pixel.
Versus SwinV2-B; leading models are comparable within variation between runs.
Different metrics; percentages are not directly comparable. Source: technical report ↗
The prize in the shadows
The first question is intensely practical. Where might there be ice?
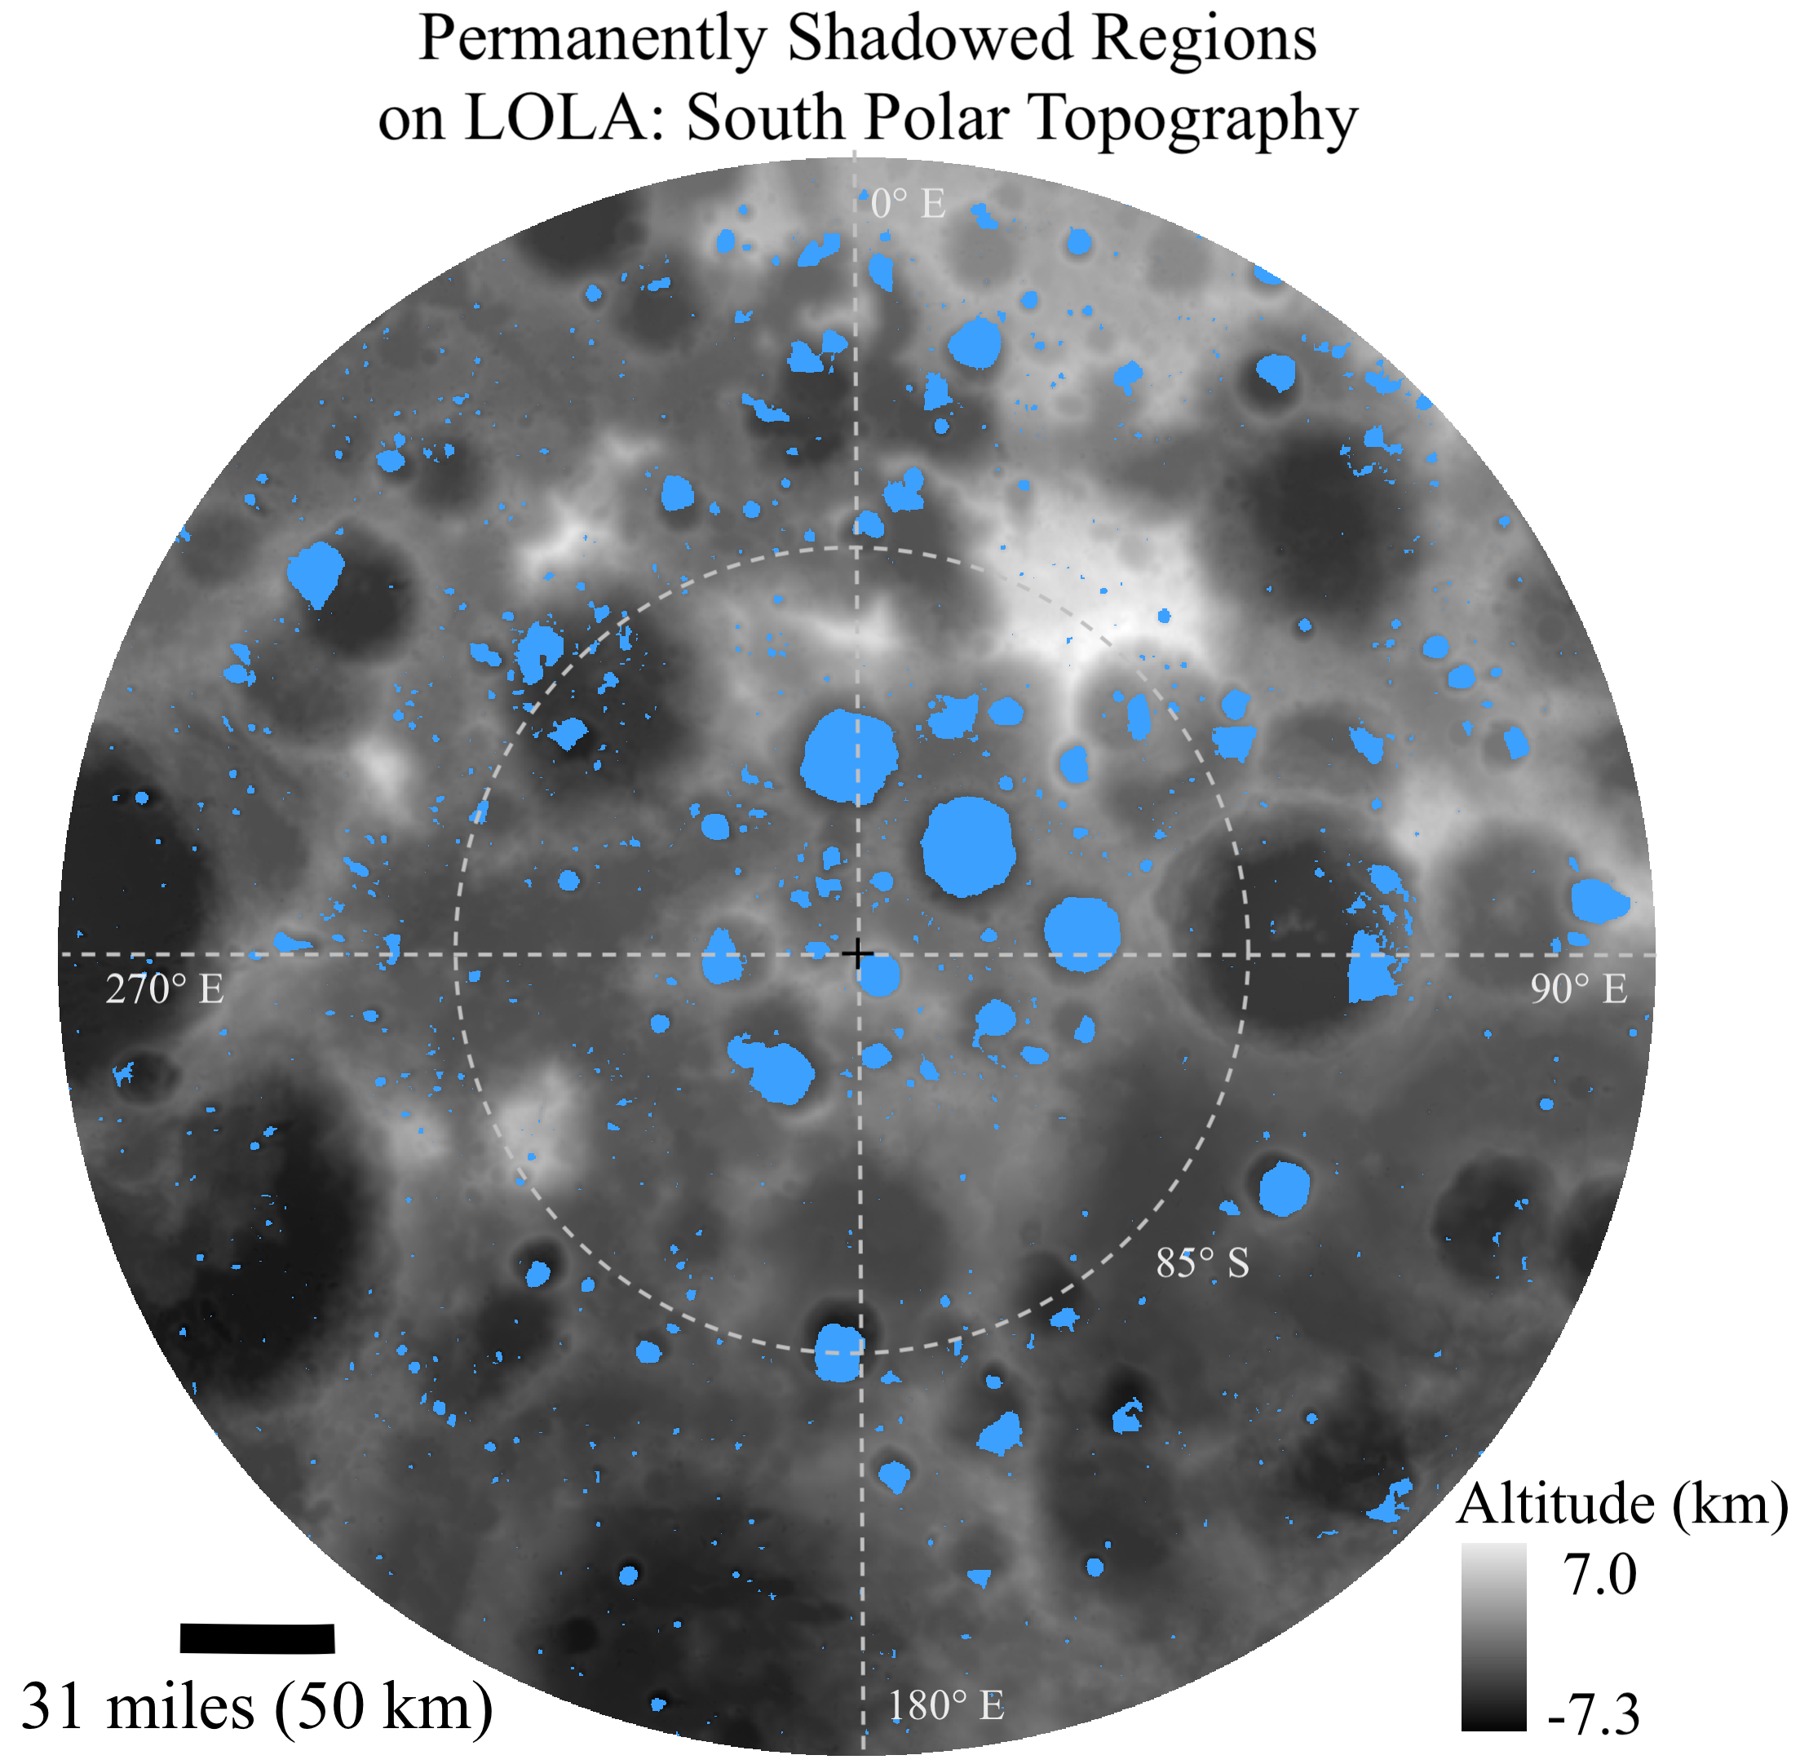
Near the lunar poles, some depressions remain permanently shadowed. Their cold surfaces can preserve water molecules that would be lost from sunlit ground. NASA’s earlier LRO research found evidence for ice beyond the largest south-polar shadowed regions, while also showing why a map of likely deposits is only part of the work. The amount, depth, and accessibility of that ice still matter.
In the cited ice-prospectivity test, the NASA-IBM model reduced root mean square error by up to 22% compared with SwinV2-B, a model pretrained on ImageNet. The target is a map of ice potential. A better prediction helps researchers decide where to investigate; it does not amount to a scoop of recovered water.
The attraction is easy to grasp. Water can support people on the surface. Its hydrogen and oxygen can serve as ingredients for rocket propellant, while oxygen also supplies breathable air. If usable deposits can be located and accessed, they could change what an expedition must bring from Earth. The journey from a promising pixel to a working supply is long, but choosing the pixel is a consequential beginning.
A crater is both a clock and an obstacle
Crater maps serve two audiences. Scientists read impact patterns to investigate the ages and histories of terrain. Mission planners read the same surface with a more immediate concern: where can a spacecraft land, and where can people and equipment move safely?
IBM reports nearly 19% better context-scale crater performance against SwinV2-B using half the training data. Here, context scale means imagery at approximately 100 meters per pixel. In the report’s half-data comparison, the nearly 19% gain appears in AP@75, a detection measure requiring a relatively close match between predicted and reference boxes. It is not a blanket 19% improvement across every measure of crater detection.
At meter scale, the reported result is comparable accuracy to leading alternatives. That distinction matters. Broad terrain context and fine surface detail answer different questions, and a successful score at one scale does not settle the other.
Using fewer training examples is appealing because somebody must establish what those examples contain. A model that makes better use of labels could let researchers stretch a limited annotation budget. More useful crater maps can inform the assessment of landing hazards and infrastructure sites; operational decisions still require their own validation.
make data easier for scientists to explore and use
Kevin Murphy · NASA
September 10, 2026 announcement ↗
The Moon’s volcanic alibi
Then there are the irregular mare patches: small features whose mixed textures invite questions about the Moon’s volcanic history. NASA describes smooth, rounded mounds beside rough, blocky ground. Their modest size belies their scientific importance. Some have been interpreted as evidence that lunar volcanism continued much later than once assumed.
Mapping their boundaries helps researchers study the extent of these deposits and examine how the Moon’s interior cooled. A volcanic feature is a clue to a process beneath the surface, not merely an interesting shape above it.
In the cited tests, IBM reports about 3% better mapping of these features against SwinV2-B despite imperfect labels. The technical report describes the strongest models as comparable when variation between runs is considered. The useful result is a promising tool for delineating awkward terrain, with the comparison kept at its proper scale. Geology has little use for a victory declared more confidently than the evidence allows.
An invitation with something to build on
The release places a domain model and its underlying data in public reach. That pairing is the strongest evidence here for IBM’s open AI strategy. Researchers need both a starting model and a route back to the observations: something they can adapt, inspect, compare, and improve for their own scientific questions.
NASA’s Kevin Murphy framed the challenge as making scientific data easier to explore and use. An archive can be extraordinary and still be difficult to work with. The value of this project rests on reducing that distance.
IBM places the lunar model within its wider Prithvi family of open scientific foundation models. The lunar release gives that approach a concrete test: a specific world, a shared dataset, and measurable tasks whose outcomes researchers can examine.
The next discovery will depend on the questions people bring to it. One group may investigate a shadowed crater; another may revisit a volcanic boundary. An open model lets each begin with work already done. The Moon has kept its records for billions of years. More readers now have a place to start.
Five questions, answered
What is the NASA-IBM Lunar Foundation Model?
It is a publicly available foundation model for lunar remote sensing, released on September 10, 2026, that researchers can adapt to scientific tasks.
Which observations does the dataset bring together?
More than 30 spatially aligned layers from nine instruments across four missions: LRO, GRAIL, SELENE/Kaguya, and Lunar Prospector.
Has the model discovered usable lunar ice?
The cited test measures prediction of ice potential, with up to 22% lower RMSE versus SwinV2-B. It does not establish recovered or commercially usable ice.
What does the nearly 19% crater improvement mean?
It refers to context-scale crater detection at roughly 100 meters per pixel. The half-data comparison shows that gain in AP@75 versus SwinV2-B, rather than in every detection metric.
Why does open sourcing the model matter?
Researchers can build on a shared lunar model and dataset, adapt them to new questions, and examine the reported comparisons.